April 13, 2026
Introduction
In this article, we will walk through the process of checking the amount of resources your job is using on Scientific Computing (SciC) Linux Clusters. Using RTM and Linux, the CPU and memory usage can be tracked.
Pushing a Job to the Interactive Queue
In order to be able to track the resources of a job, while it is running, you need to know the Job ID and the node that it is running on. These two pieces of information are given to you once a job is opened on a compute node.
First, a login session has to be opened on a compute node. Users are advised not to run jobs on the SciC Linux Clusters login nodes, so the command below is the easiest way to push your job to the interactive queue:
bsub -Is /bin/bash If X11 forwarding is required for graphical applications like Matlab, then use the command:
bsub -Is -XF /bin/bashOnce in the interactive queue, you will be automatically directed to an available compute node. Please note that it may take a while for your job to be dispatched to a node. When dispatched, you will receive an output similar to this:
Job <843267> is submitted to default queue <interact>.
<<Waiting for dispatch ...>>
<<Starting on cmu016>>
From this output there are two things to keep track of. In the first line, we need to remember the job ID, which can be found in the “Job <XXXXXX>”. In this case, the job ID is 843267. Also, be sure to know which node you are working on. For this example, we are working in the cmu016 node.
Using RTM
To see all the information about your submitted job, login to https://eris1rtm.partners.org/ using your Mass General Brigham login.

Once logged in, you should be presented with a summary of all your submitted jobs. In the navigation bar at the top, select the “Grid” tab, and you will see a table of all the interactive queues.
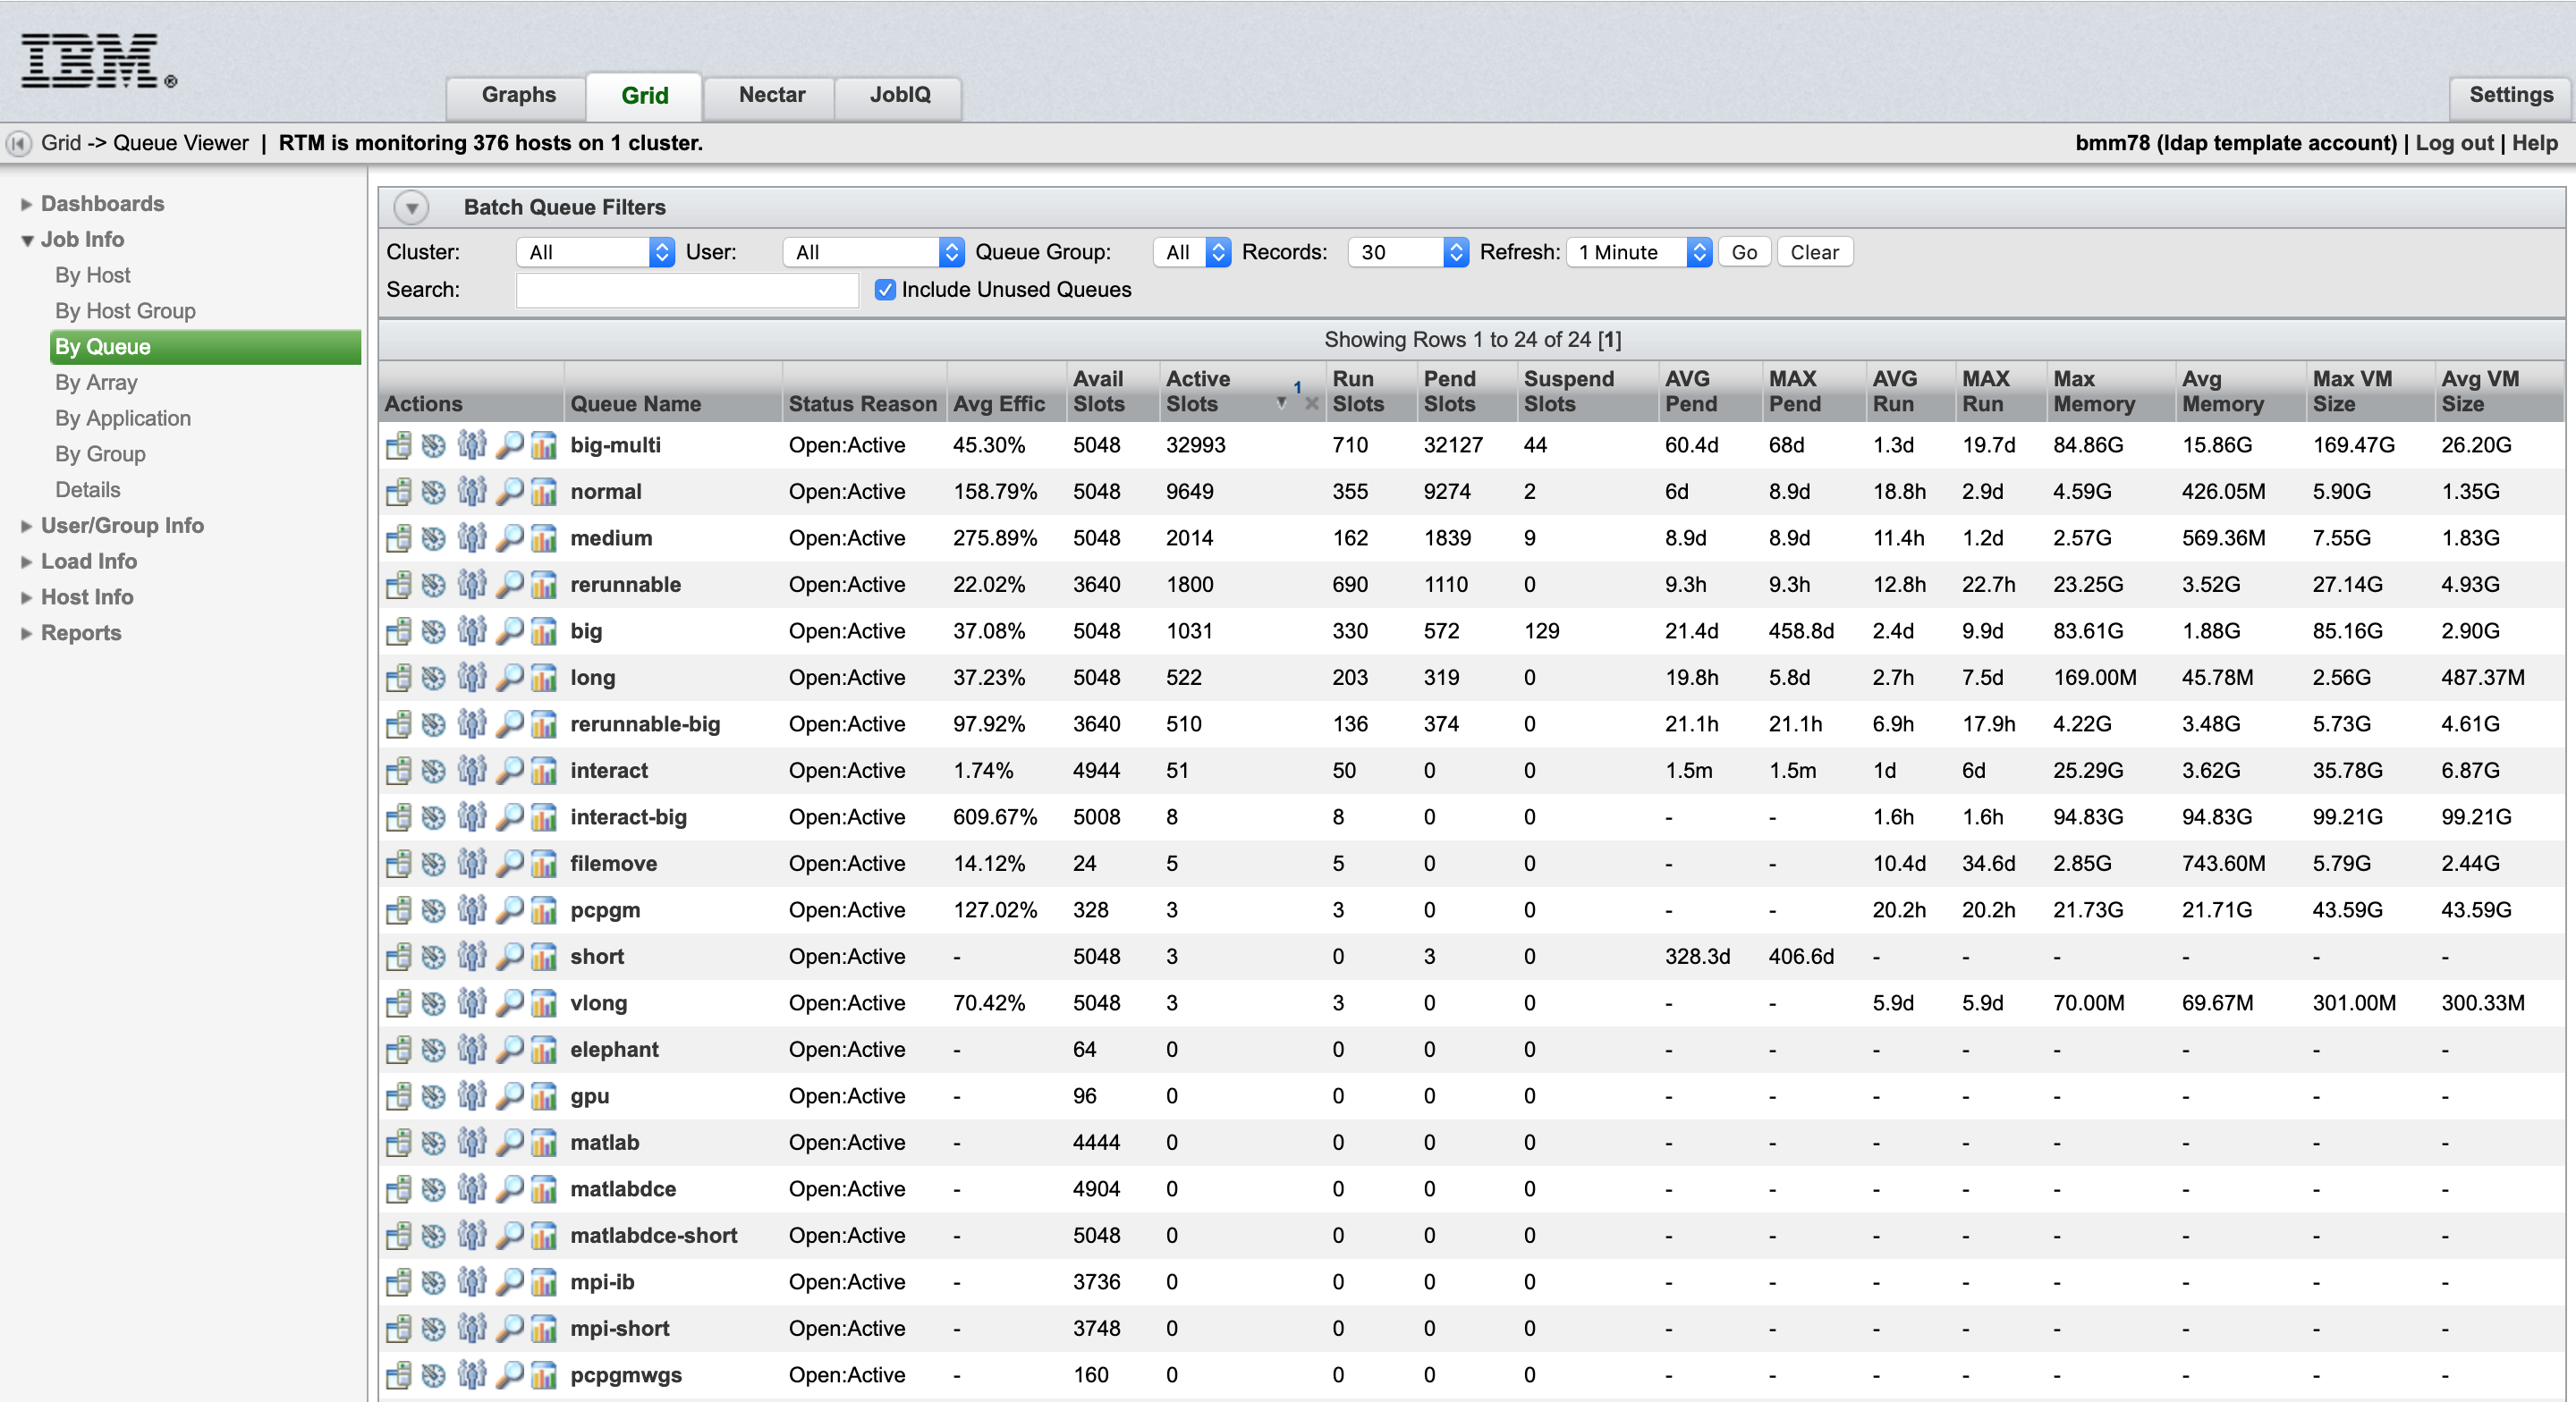
In the side bar, under the “Job Info” tab, you are given the option to filter through the jobs by Host, Host Group, Queue, Array, Application, Group, and Details. To search for your job, click the details option. In the JobID field, you should be able to type in the Job ID you saved from before, and upon pressing enter, information about your job should appear. Clicking on the Job ID will give you a table of all information relating to this job.
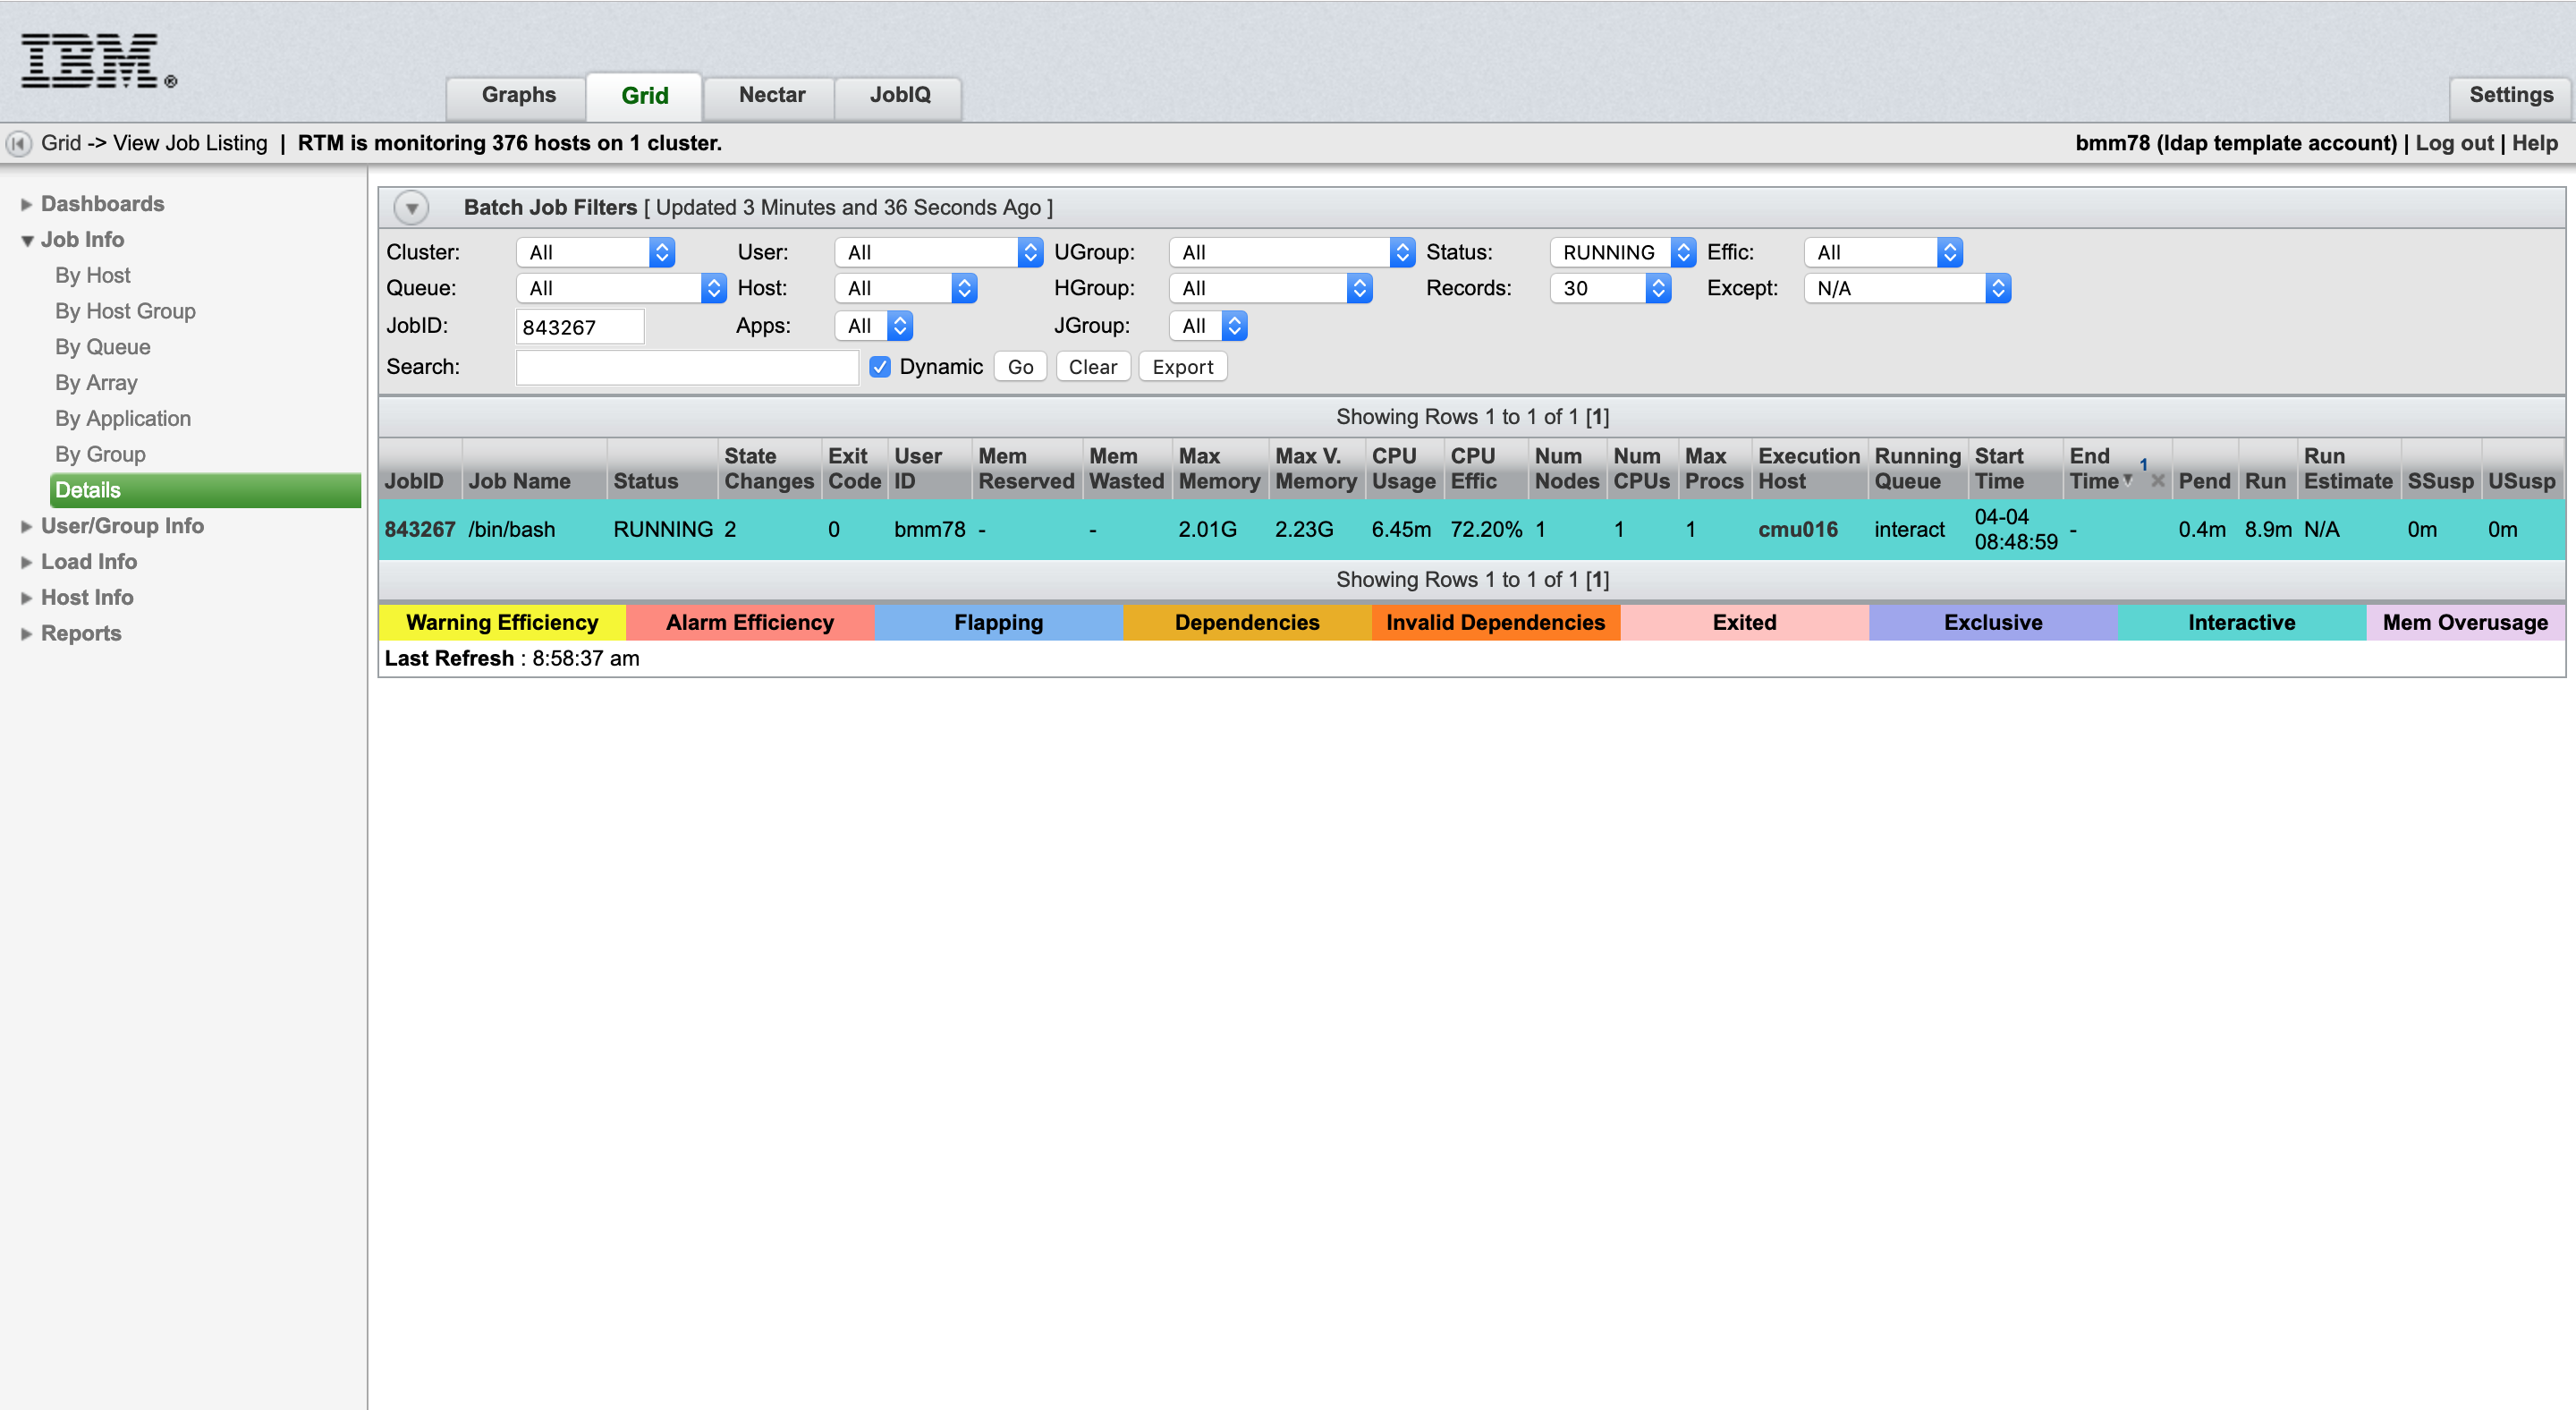
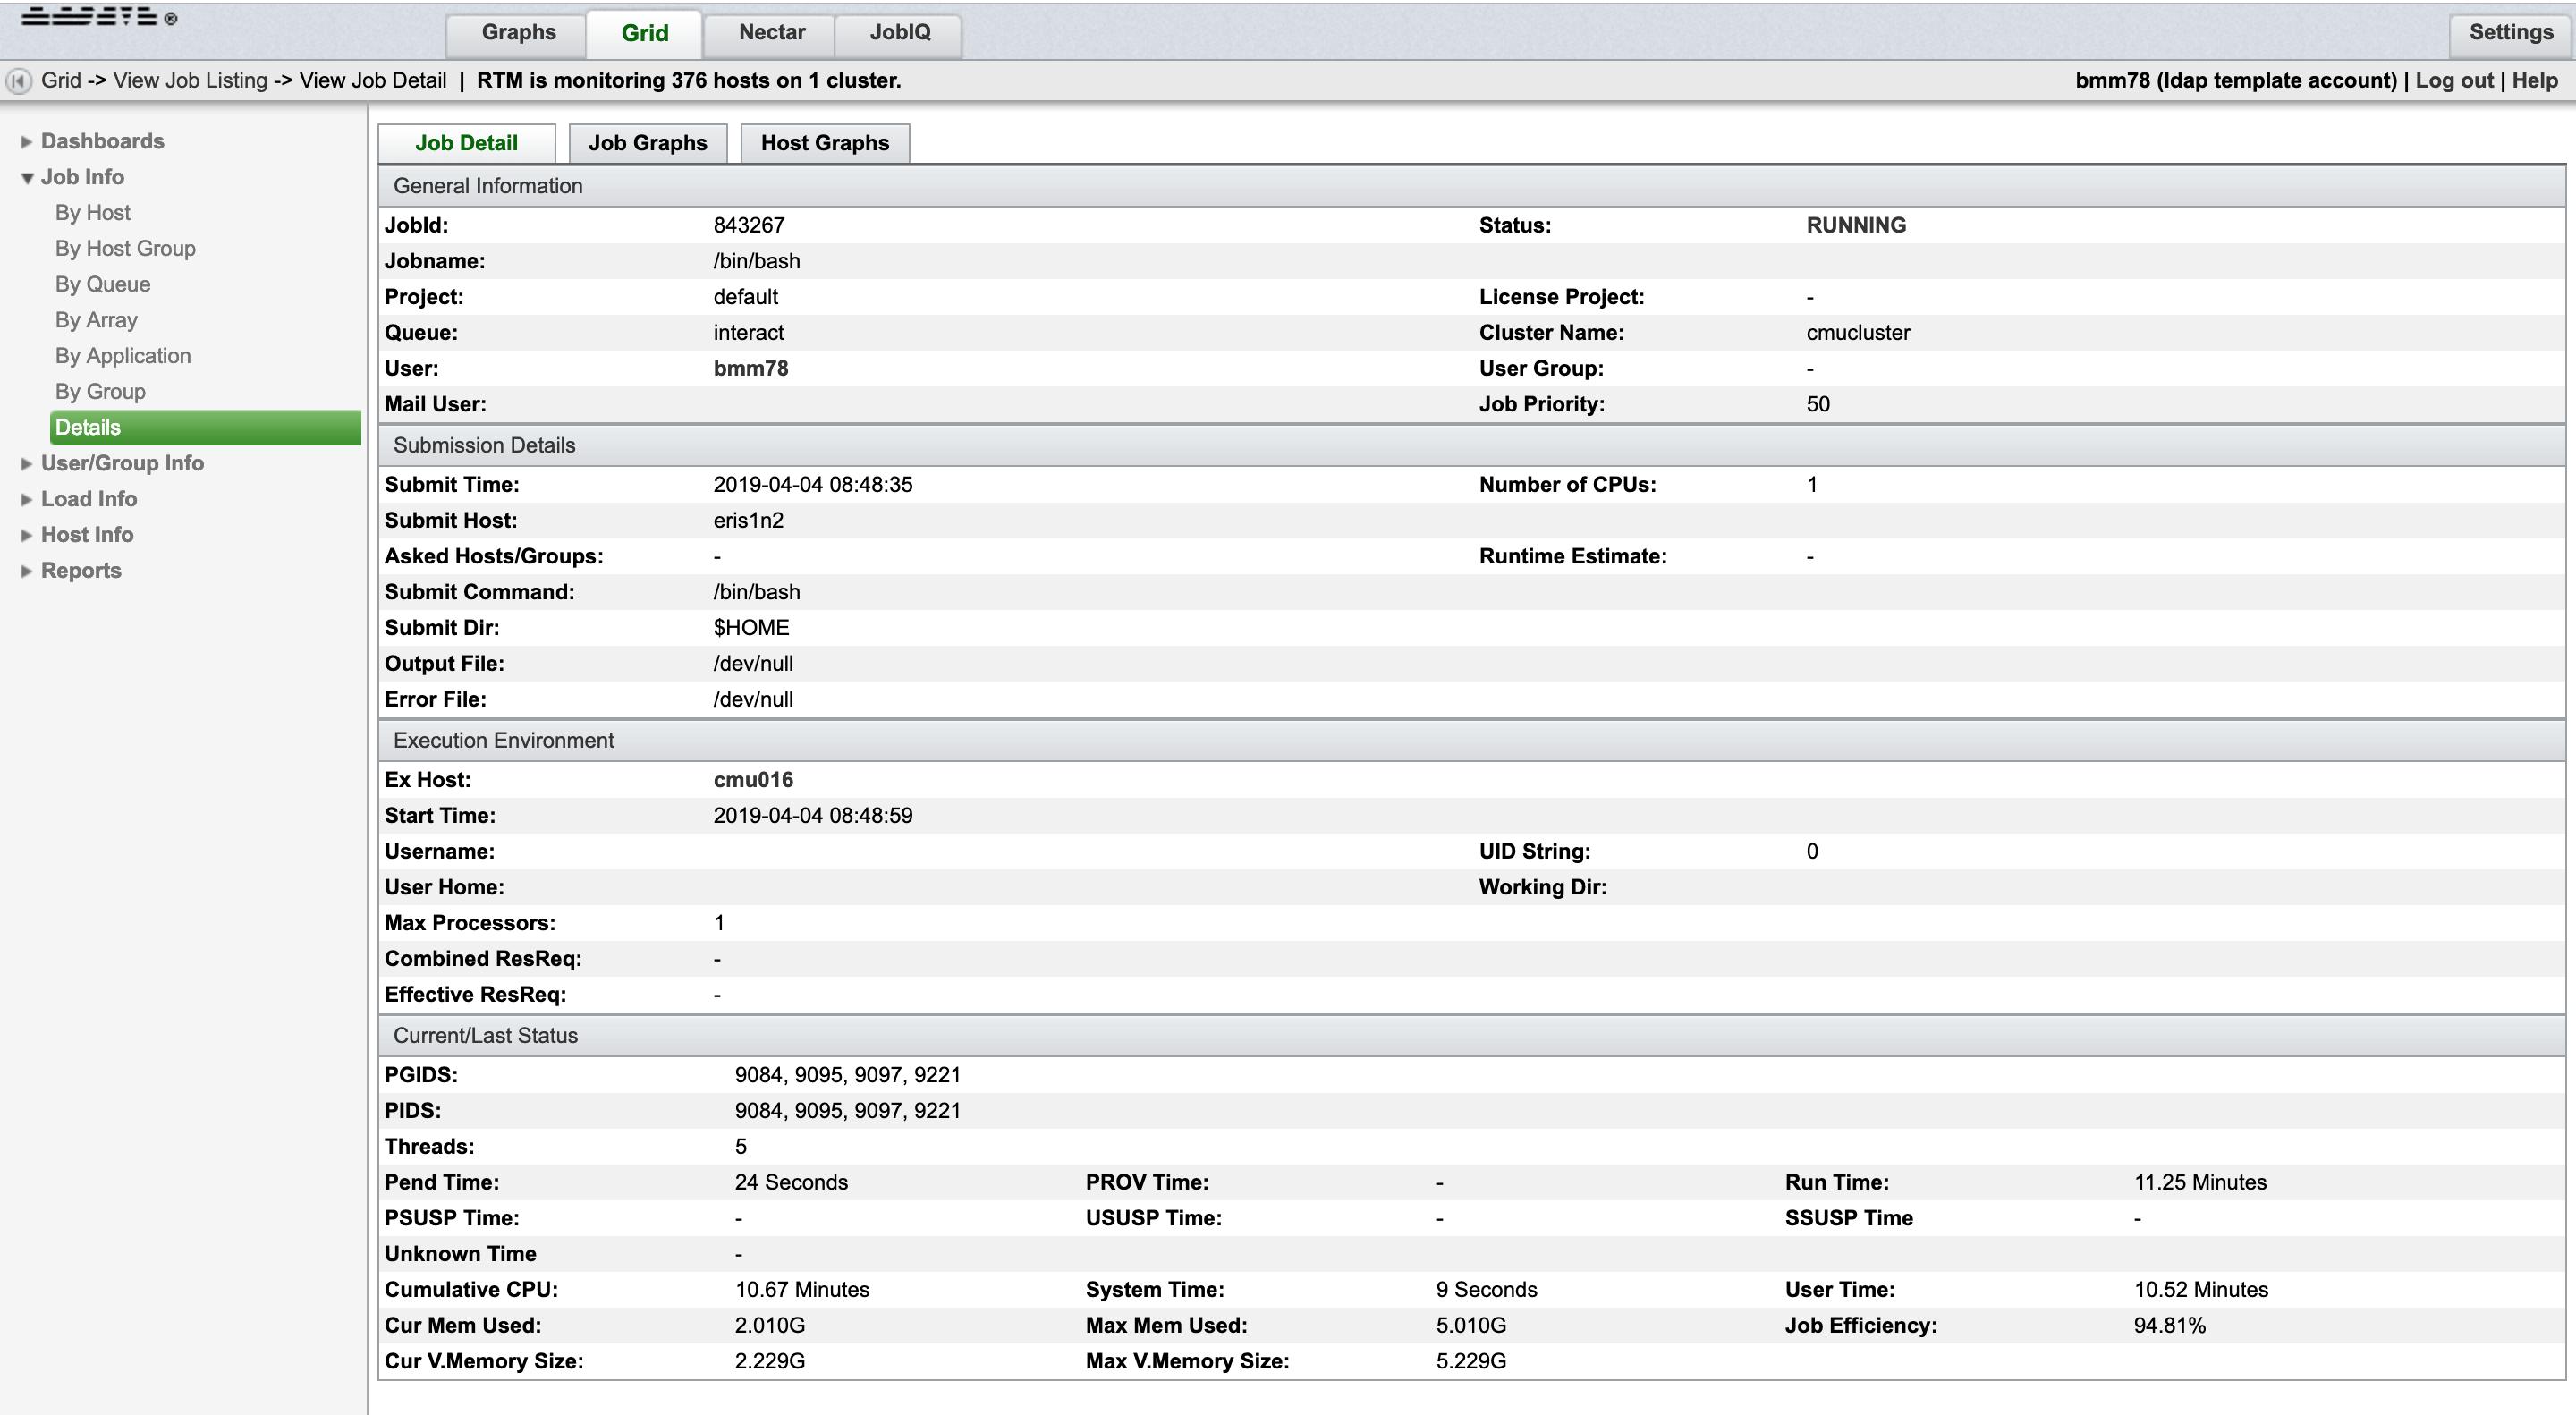
Important fields to keep track of would be “Max Mem Used” which represents system ram. “Max V Memory Size” is the virtual memory being used, this includes swap memory as well. Here, you can also find your job's process ID, PID.
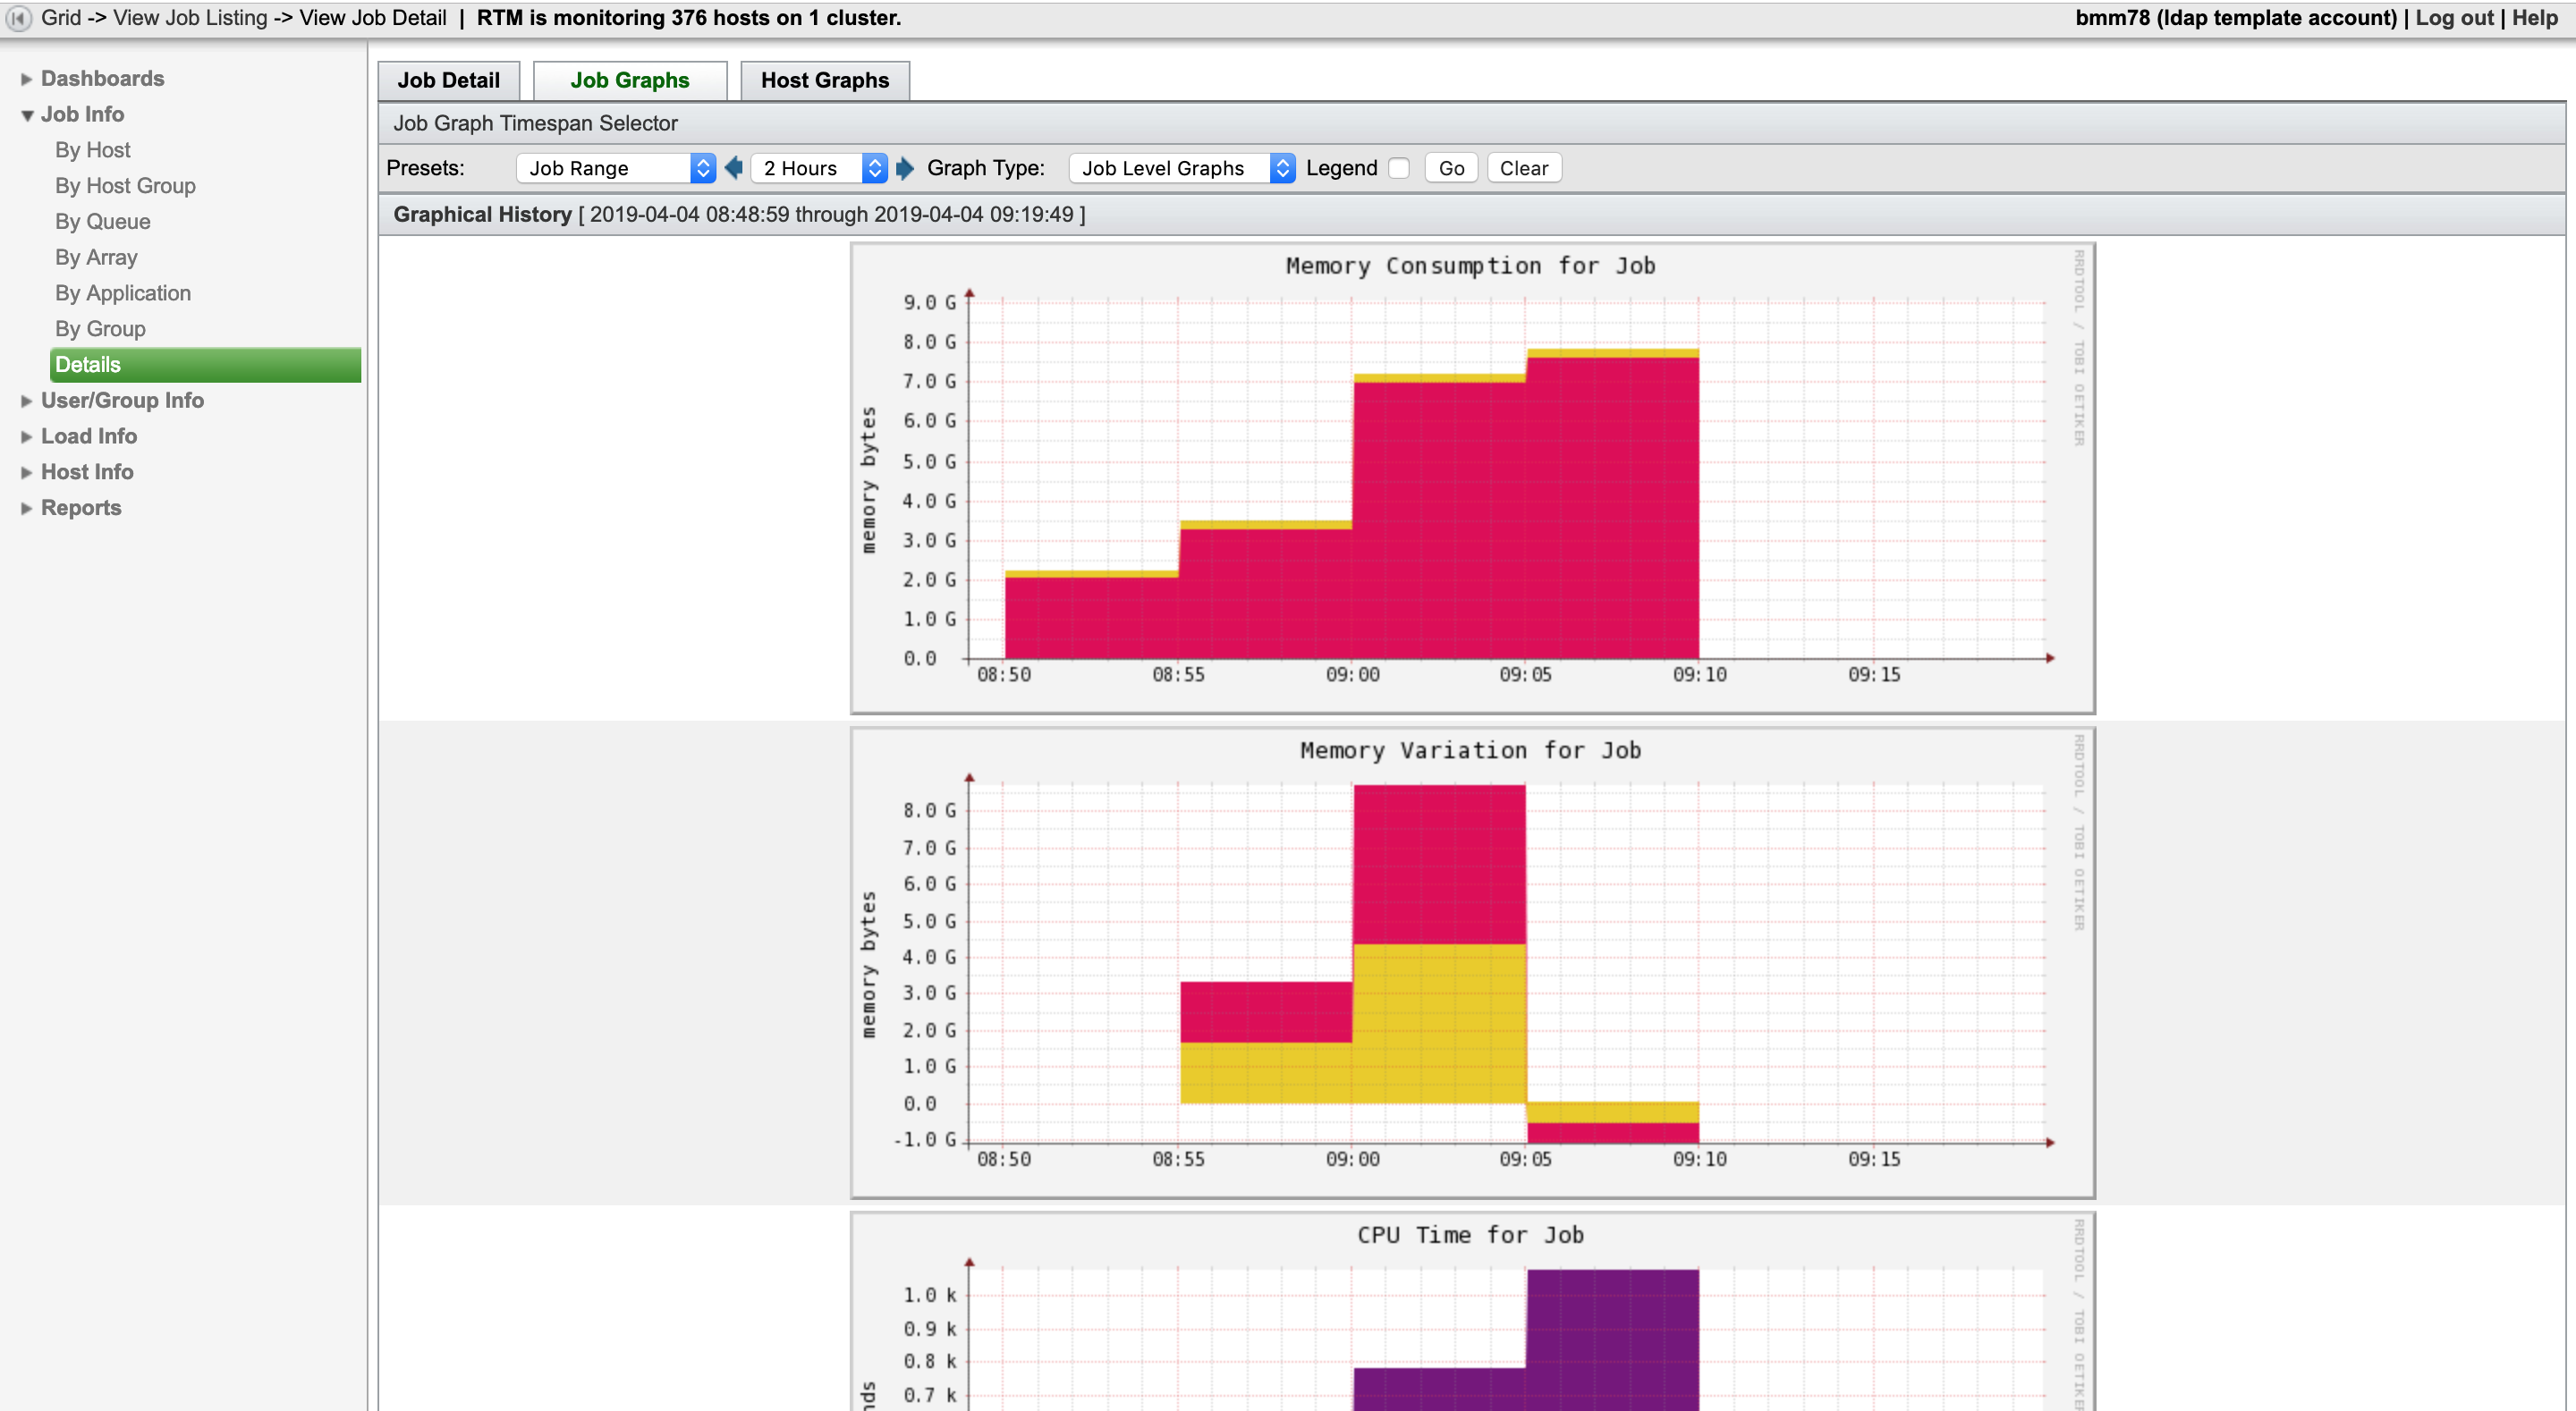
If you would like to visually see the resources your job is using, then the “Job Graphs” tab will present you with multiple graphs that show information on Memory, CPU, and PID.
Using Linux Tools
Another way to see the resource use of your job is by using Linux. There are a few commands all users can utilize once they are logged into the cluster in order to see information on any of their processes. While your job is running, open a separate tab in your terminal, and ssh into the node that your job was pushed to.
The “htop” command is a good tool to uses to see information on your process. It will give you an output similar to the one below.
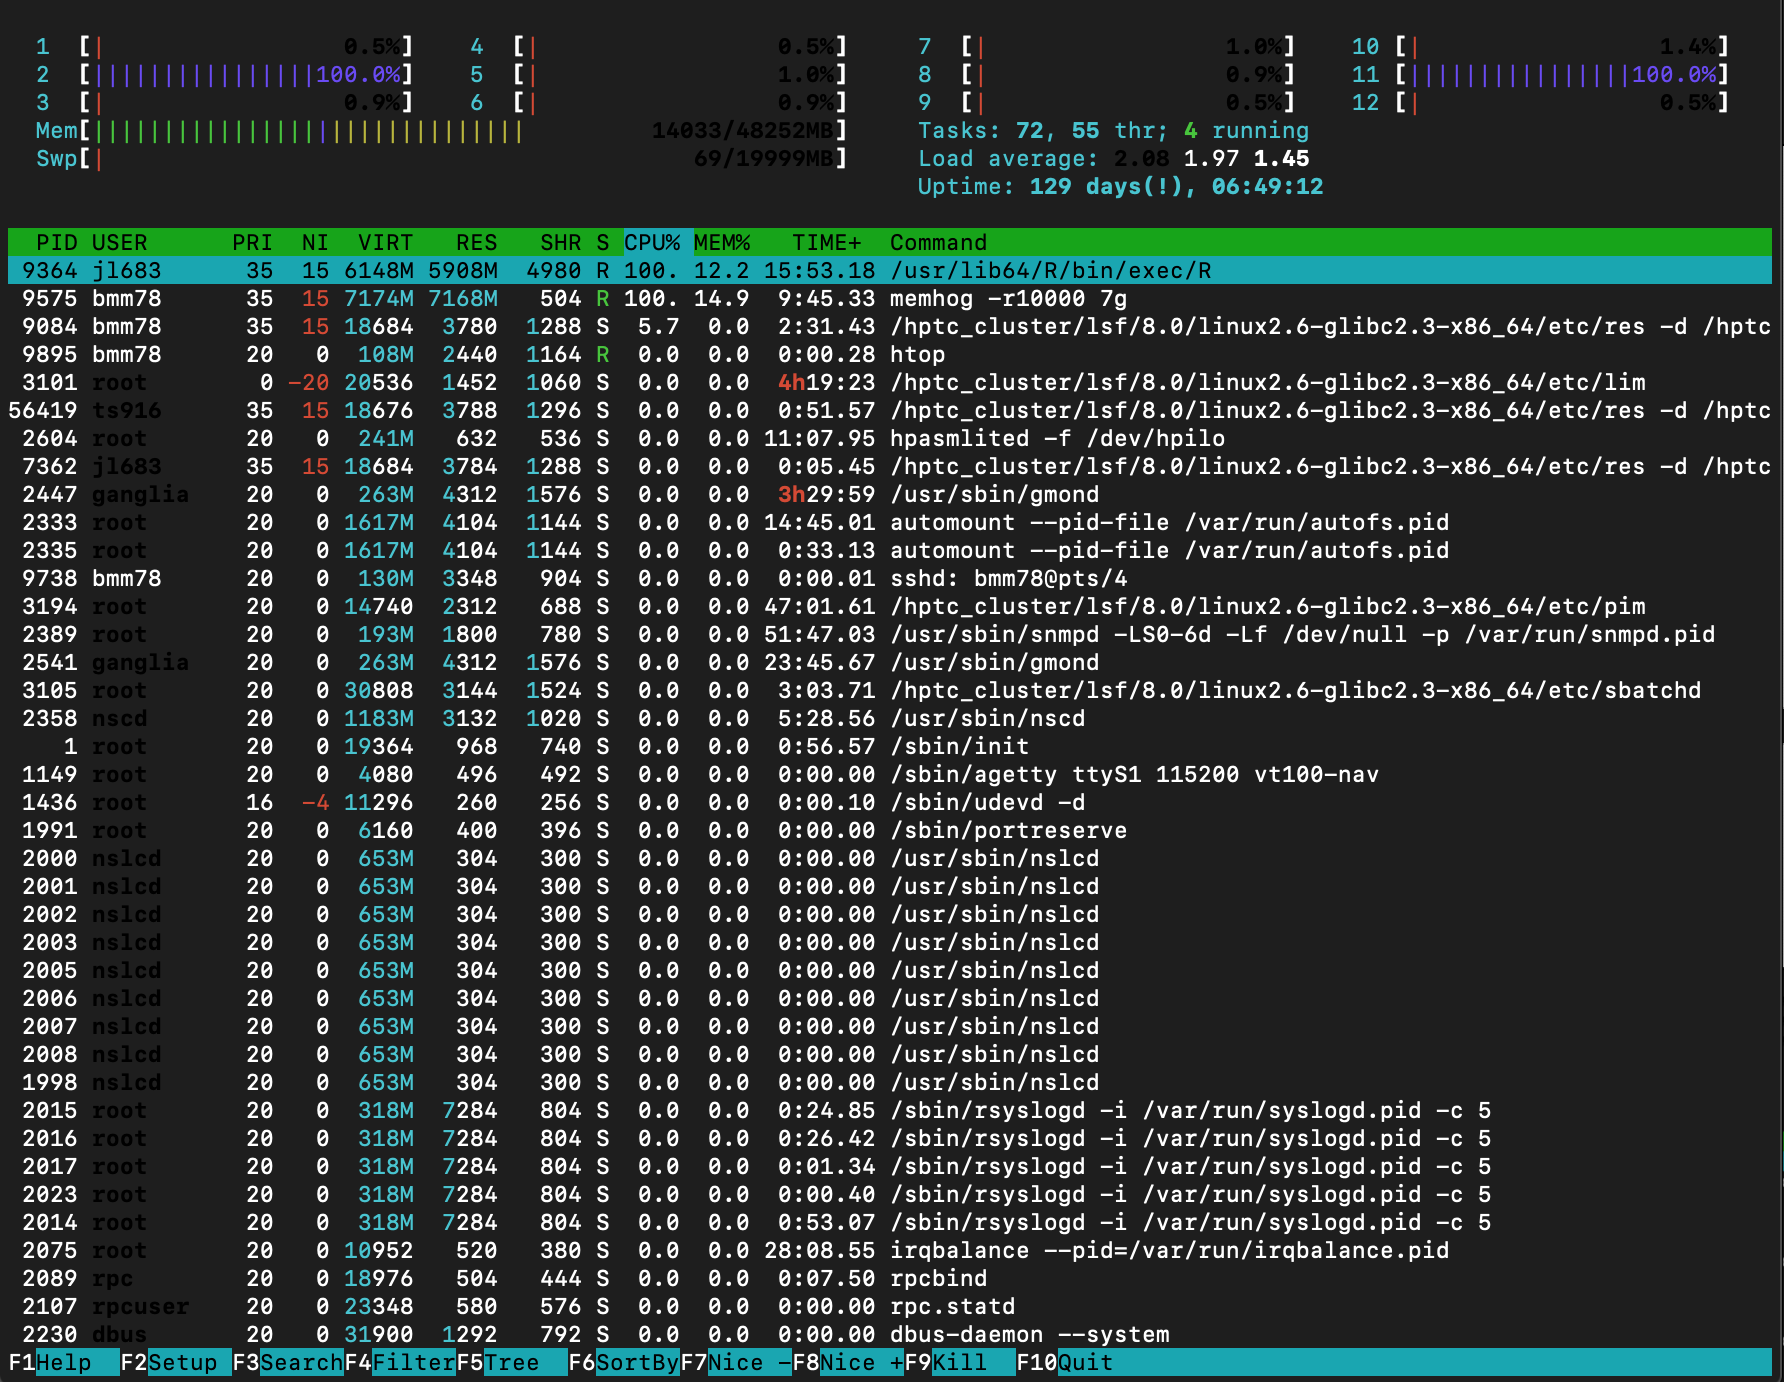
There are two vital parts of the htop output. It shows the CPU%, 100% refers to 1 full core usage, 200% for 2 cores, etc. In addition, it also shows the amount of memory and swap memory available that is available on the system. The colored bar at the top describe the columns listed.
The rest of the output shows the list of all the processes that are currently running, as well as their CPU and memory use. In the figure above, you can see that all the process that are not being ran by that user are shaded out. That can be toggled within your options.
To exit the htop output, press the “q” key.
Another way to use Linux to see your job's resource consumption is by utilizing the "ps aux" command. Similarly, this output shows all of the processes currently running on the system accompanied by their CPU and memory use. An example of the output is in the figure below.
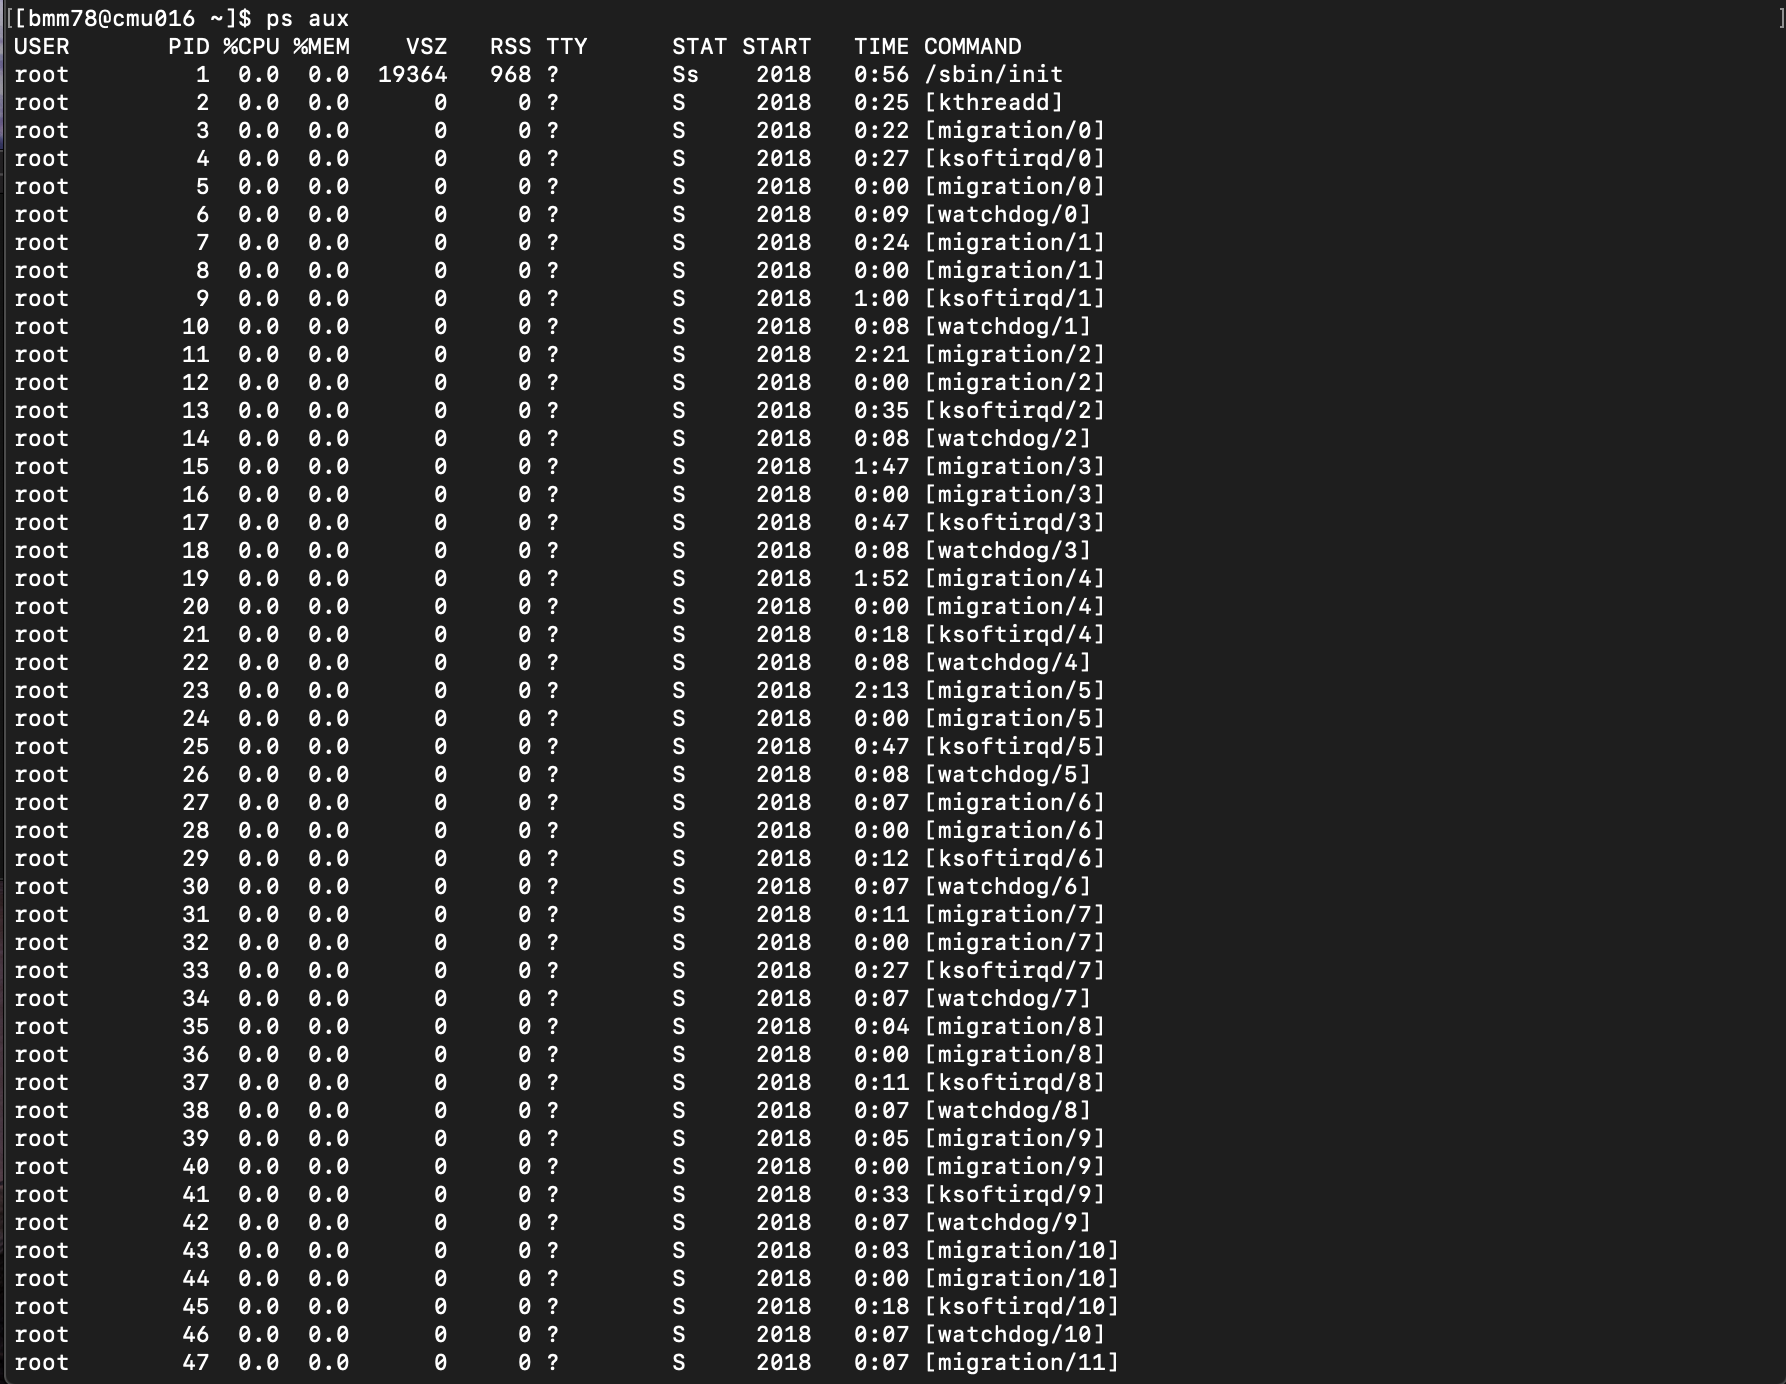
Since the output of the "ps aux" command can be extensive, it is better to filter your results to the process you want to see. To do this, we will pipe the output to be the input of the grep command. For that you would type,
ps aux | grep <PID>
For example, if our job's process ID was 9575, then we would type this:
[bmm78@cmu016 ~]$ ps aux | grep 9575
bmm78     9575 99.9 14.8 7346180 7340616 pts/3 RN+  09:07  11:26 memhog -r10000 7g
bmm78     9952  0.0  0.0 103256   868 pts/4    S+   09:18   0:00 grep 9575
And it will return the information on the specific process. Remember that the third column is the CPU% usage and that the fourth column is memory usage.
Now, you should be able to point out how much resources your jobs' are using. If you notice that your job would benefit from having more resource available, then please use this article to walk you through the process, https://rc.partners.org/kb/article/2735.
