The PDSR i2b2 Query Tool is a web-based application providing researchers a true count of patient totals from the Complete PDSR Curated Data Set that meet user-defined characteristics and criteria such as diagnoses, procedures, medications and/or laboratory results.
To get access to the Complete PDSR i2b2 Query Tool, you must first be provisioned access to the Complete PDSR Curated Data Set.
The Complete Patient Data Science Repository Curated Data Set is a repository of patient data obtained from PDSR and filtered down to conform to a limited data set standard as defined by HIPAA. You will need to submit a ServiceNow form to request access to the Complete PDSR Curated Data Set. To view the instructions on how to submit your request, please review the Request Access section in the Complete PDSR Curated Data Set Dashboard.
Once access is approved and provisioned, researchers access the data set within the MGB Analytics Enclave. The MGB Analytics Enclave is where researchers will find their project workspace which has been provisioned for them. Access to the query tool is granted the following day after access to the Complete PDSR Curated Data Set is provisioned. The project workspace is where researchers access the PDSR Curated Query Tool and where data querying/analysis is done. Additional details about accessing the tool are provided once access is provisioned.
Detailed instructions about tool functionality is found within the tool by clicking Help on the top right once logged in.
QUICK HELP
- To create a query, go to the Navigate Terms panel on the upper left hand side of the portal. You will see folders for various types of data. Expand these folders by clicking on the + to the left of each folder, select terms of interest and drag them to the Query Tool Group panels on the right one-by-one. You may drag over as many terms as needed.
- Not all folders are draggable.
-
Folders with the white bar at the bottom of the yellow folder icon are NOT draggable.

- Folders without the white bar are draggable.
- To add more query items, continue to drag them from the left hand Navigate Terms panel into the Query Tool Group panels on the right. Grouping two items in one panel means the items are 'Or-ed' together, that is, the patient must have one or the other or both of the criteria. Grouping items in two different panels means they are 'And-ed' together, that is, the patient must have that item in addition to what is in the other panels.
- You can also exclude terms in a panel by clicking on the Exclude button at the top right hand side of each Query Tool Group panel.
- Next to the Navigate Terms panel you will see the Find terms panel. You can use the Find terms panel to search for terms within any of the folders.
- Hit the Run Query button below the first Query Tool Group panel to run the query. This will give you a true count of Complete PDSR Curated Data Set patient totals who satisfy your criteria, as well as breakdowns of the sample types for the set of patients.
NOTE: If you build a query using only a single diagnosis code (icd9 code), the specificity of the query results may be low. Please refer to Tips and Tricks section and Refining Your Query for more information.
Detailed Help with Examples and Screen Shots
-
To create a query, go to the Navigate Terms panel on the upper left hand side of the portal. You will see folders for various types of data. Expand these folders by clicking on the + to the left of each folder, select terms of interest and drag them to the Query Tool Group panels on the right one-by-one. You may drag over as many terms as needed.
For example, to find the number of subjects who have had acute appendicitis, open folders - Diagnosis -> Diseases of the digestive system -> Diseases of appendix. Select 'Acute Appendicitis' and drag it into the first group panel.
-
To add more query items, continue to drag them from the left hand Navigate Terms panel into the Query Tool Group panels on the right. Grouping two items in one panel means the items are 'Or-ed' together, that is, the patient must have one or the other or both of the criteria. Grouping items in two different panels means they are 'And-ed' together, that is, the patient must have that item in addition to what is in the other panels.
To find the number of subjects who have acute appendicitis AND are male, (assuming acute appendicitis has already been dragged to the first Query Tool Group panel), the next step is to open the folders - Demographics -> Gender -> Gender (Legal Sex) folder, then drag 'Male' to the second group panel.

To find the number of subjects who have acute appendicitis OR a corn and callosities, drag both terms individually into the same panel.

-
You can also exclude terms in a panel by clicking on the Exclude button at the top right hand side of each Query Tool Group panel. The Exclude option finds all subjects who do not have the criteria in the panel. When you click the Exclude button, the none of these red box shows up on the bottom of the panel.
In this example, the query will find all subjects who do NOT have acute appendicitis OR corn or callosities.
-
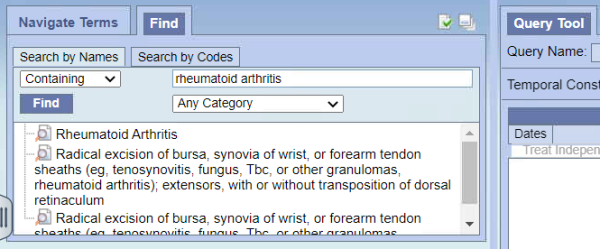
Next to the Navigate Terms panel you will see the Find terms panel. You can use the Find terms panel to search for terms within any of the folders. Drag any of the terms over to a Query Tool Group panel on the right to include it in a query.
Type term rheumatoid arthritis and press Find to see full search results.
Hit the Run Query button below the first Query Tool Group panel to run the query. This will give you a true count of Complete PDSR Curated Data Set patient totals who satisfy your criteria, as well as breakdowns of the sample types for the set of patients. Note when running a long query and one or more query options are selected, the results will focus on the Graph Results tab. Click on the Show Query Results tab to view results. -
Your query will be saved to your account and appears in the Previous Queries list. You can expand each of the rows to view the results of the query.

The PDSR i2b2 Query Tool allows you to create time-related queries (temporal queries).
Navigating Events, Population, and Temporal Relationship
-
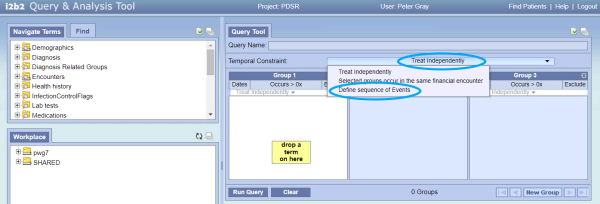
Click on the Treat Independently drop-down menu and select Define sequence of events.
-
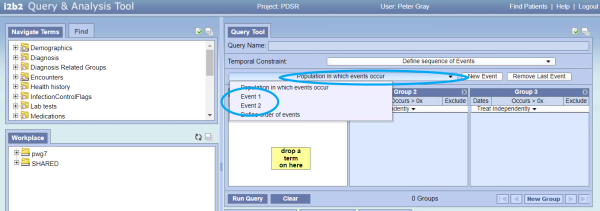
Clicking on the Population in which event occurs drop-down menu enables you to select the Observations which are called Events. Selecting Event 1 will allow you to add any concepts to the Anchoring Observation panel. You can similarly select Event 2 from the same drop-down menu to view and edit its content. At least two Events to run a temporal query. NOTE: Demographics are NOT ALLOWED to be Anchoring Observations for either Event 1 or 2.
-
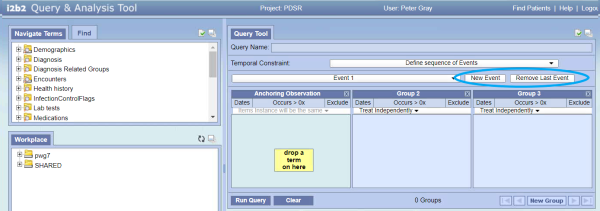
Next to the same drop-down menu, you can add an Event (click on New Event), or remove the most recently added Event (click on Remove Last Event).
-
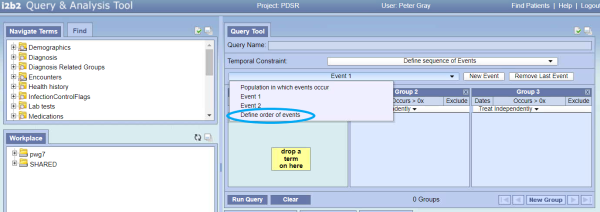
In order to see or change the temporal relationships, you need to select Define Order of Events from the drop down menu:
-
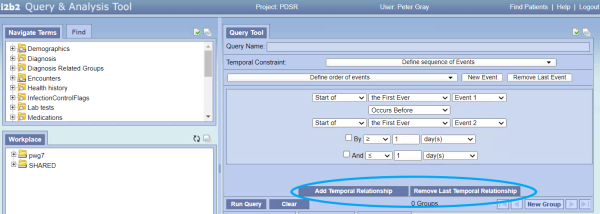
All relationships will be displayed for editing. Two descriptors are available for each Observation. One specifies whether to use the Observation's Start date/time or its End date/time to relate to the other Observation. The descriptor can be either Start of or End of. The default value is Start of.
The second descriptor specifies which occurrence of the Observation is to be used to relate to the other. This is important because there may be multiple observations for a subject. This descriptor can be one of the following values: First Ever, Last Ever, or Any. The default is First Ever.
The temporal relationship of the two Observations can be one of: Occurs Before, Occurs On or Before, or Occurs Simultaneously With. The default value is Occurs Before. A temporal range can optionally be specified to the temporal relationship. To enable the temporal ranges, check the By and the And buttons in the Temporal Relationship Editor.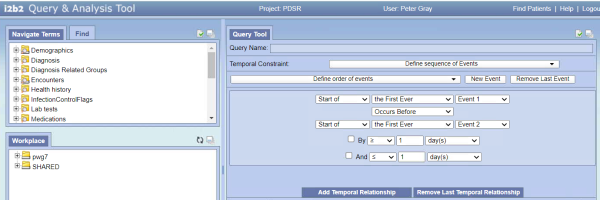
Summary tables for the descriptors and relationships are provided below for quick reference.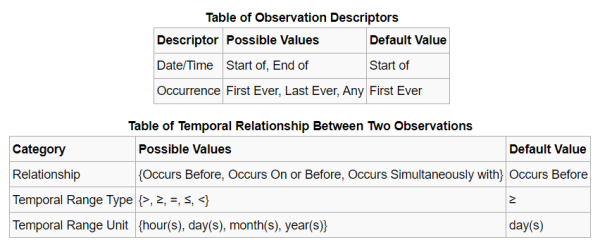
-
You can add a temporal relationship by selecting the Add Temporal Relationship button at the bottom. You can can also remove the most recently added relationship by selecting the Remove Last Temporal Relationship button.
Running A Temporal Query
-
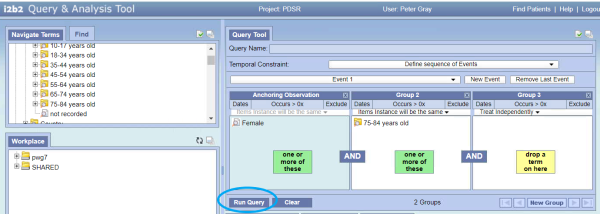
Temporal queries can be submitted by clicking the Run Query button at the bottom left of the query tool.
-
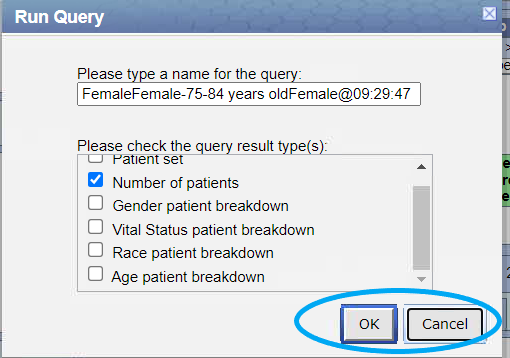
A confirmation dialog will pop up. You can select one or more query result types. Select Run Query to execute it. Alternatively, select Cancel to close the dialog without running the query.
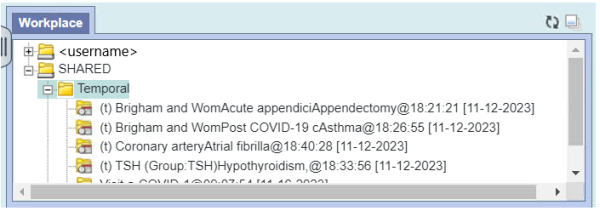
The Workplace panel located in the middle of the left-handed sidebar is a space where users can store work in progress. By default there are two folders in the Workplace, SHARED and <username>. Draggable concepts can be dropped from the Navigate Terms panel to either folder. If dragged to SHARED, everyone with access to the tool can view the details. If dragged to the <username>, only the user will be able to see and work with the concepts.
These files and folders can be dragged to the query tool panel.
Previous Queries, similarly to Workplace, contains objects that can be dragged to the query tool panel. Similarly to Navigate Terms panel, Previous Queries can also be searched via the Find tab on the panel.

Tips
- If you are looking to query for patients of a specific age when xyz occurred, construct your query to include Encounters -> Age at Visit search term. Age at Visit can only be used with an additional search criteria representing xyz such as a Diagnosis or Visit. The demographics breakdown results will display the current age of patients.
-
If you are querying for patients specifically for recruitment or eligible metrics for recruitment, be sure to EXCLUDE patients who have opted out of Research Invitations program. We recommend your query:
- Excludes PatientConsents -> Research Invitations -> Patient has opted out of Research Invitations by dragging the term into a term and selecting Exclude to ensure these patients are NOT included in your query cohort.
- Run query with the Temporal Constraint of Treat all groups independently.
Example:

- For queries using Lab tests, run using a temporal constraint of Treat all groups independently. Otherwise a result of zero patients will be returned.
-
You can apply a date constraint when using Phenotype criteria. This will locate the date of the 1st ICD code in patients chart that met the selected phenotype algorithm.

- When running a Demographics -> Gender query using either Gender (Legal Sex), Gender Identity, or Sex at Birth, the demographic breakdown/table will display the distribution of the patient's legal sex.
-
You can hover your mouse over query criteria to view the ontology mapping.

REFINING YOUR QUERY
Increase the recurrence of an event
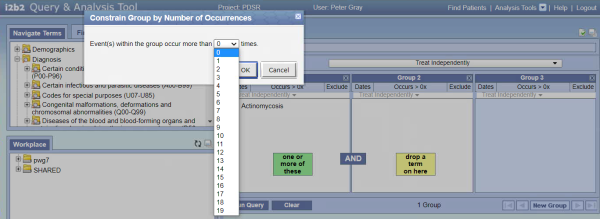
When using a search term to build a query, you can refine your query by specifying the number of times, or recurrence, that the term/code is found in a patient's EHR. By default, the recurrence is set to 1 or more (>0). This means that the patient may the code listed more than one time in their EHR. In order to increase the recurrence of a specific term, click the 'Occurs >0x' button.
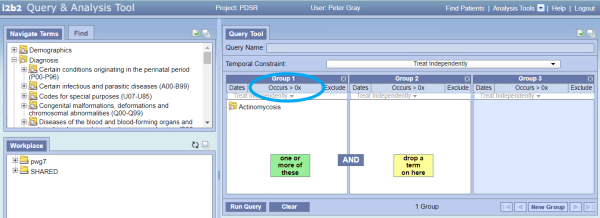
Then select the recurrence that you think works best for you. A greater recurrence will result in a smaller patient cohort. You can try different options out to find the one that works best for you.
