
September 18, 2026
Introduction
Strategy is Insight's reporting platform. It integrates with Insight seamlessly, elucidating high-level trends and results while hyperlinking to related records in Insight for focused review. This user guide explores basic navigation and reporting operations to enable user-driven analytics.
Accessing Strategy:
- Enter the following URL into your browser: https://insightanalytics.partners.org/MicroStrategy
- Login with your MGB credentials.
- Upon successful log-in, you will see the Strategy Projects page. A Project is the highest-level view and contains specific data for different areas of our enterprise. Depending on your access, you will see different projects available to you.

Navigating Strategy:
The Project Homepage is your landing for Strategy navigation. From here, you can view a variety of views and reports, both you and others have created. There are four navigation branches you can select from the homepage:
- Shared Reports: Displays reports that have been shared across the project by others, for multiple users to access.
- My Reports: Displayers reports that you have personally saved, for only you to access.
- History List: Displays recently run reports with results.
- My Subscriptions: Displays reports you are subscribed to. You can also view “Personal Views” you created of shared reports. This will be your most commonly used section and is the encouraged option for housing your personalized reports.
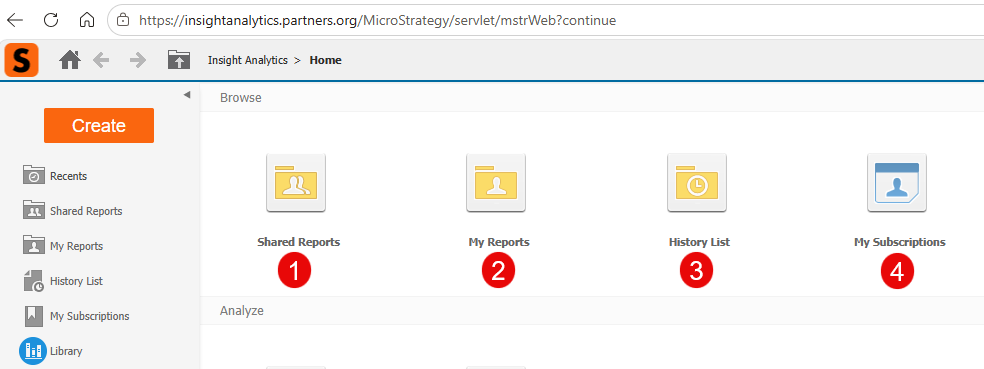
To return to this homepage at any time, click the orange “M” in the top left corner of your screen. To return to the Projects selection page, click the dropdown arrow on the orange “M” and select “Projects.”
Most often, you will be navigating the “Shared Reports” folder to view existing reports and the “My Subscriptions” folder to view your customized Personal Views of these reports to view your specific data filtering.
Under Shared Reports, when you locate the report you are interested in, click on the name or icon to run it. The following sections detail how to run reports.
Navigating Reports:
While the structure of reports is already defined, you can adjust filtering and details to create the data view most suited to your needs. Your access level may impact the amount of data you can view in Strategy.
Some reports have pre-selected prompts that users can filter results from the beginning. Some of these prompts are optional and some may be required before running the report. After selecting specific objects in the filter, click the 'Run Report' in the bottom-left.
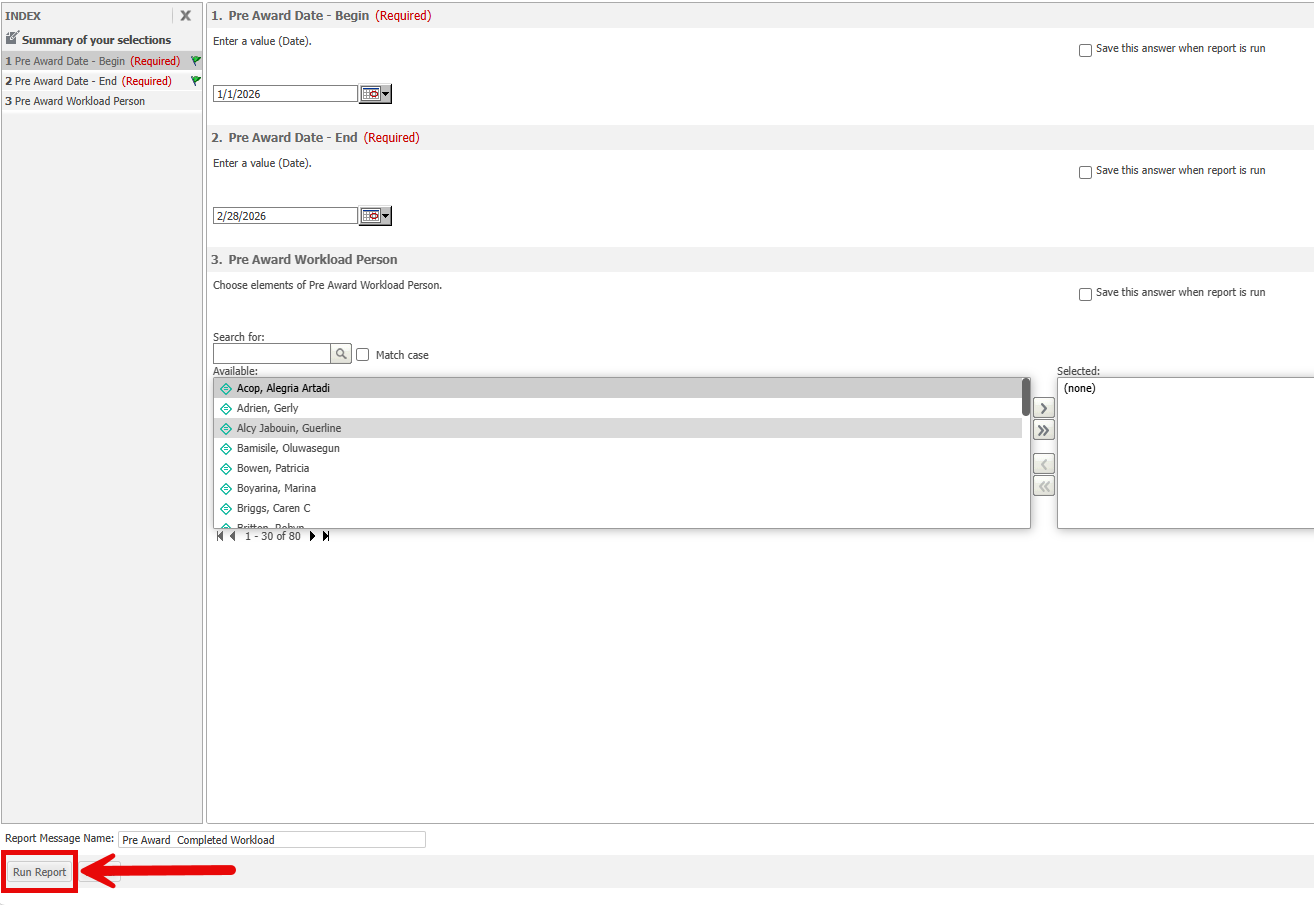
All reports utilize the same overall structure seen below:
- Grid: The Grid is the core of the report and is where data results populate. By adjusting the report objects and filters, the Grid will reflect data results. Similar to a PivotTable, the specific columns can be reordered to create a different grid layout.
- Report Objects: Report Objects houses the data objects available for the report. You can add/remove these objects from the Grid to customize the data result you want.
- Report Details: Report Details shows the pre-run data filtering that may have occurred on your report. This affects the data that is queried overall for your report, as opposed to the View Filter which only visually filters data from the Grid. If you completed optional or required reporting prompting before running the report, you will see those details in Report Details.
- View Filter:View Filter contains the specific filtering details you added into the report, based on specific objects in the Grid.
- Toolbar: The Toolbar features a variety of tools, including data export, report saving, and data totaling.

Adjusting Grid Objects:
To adjust the data in the Grid, there are two main options: filtering on specific objects or adding/removing objects from the grid.
- To add an object to the Grid, either double-click the object in Report Objects or click-and-drag the object directly into the grid. Similarly, you can adjust the ordering of objects in the Grid by click-and-dragging them in the Grid.
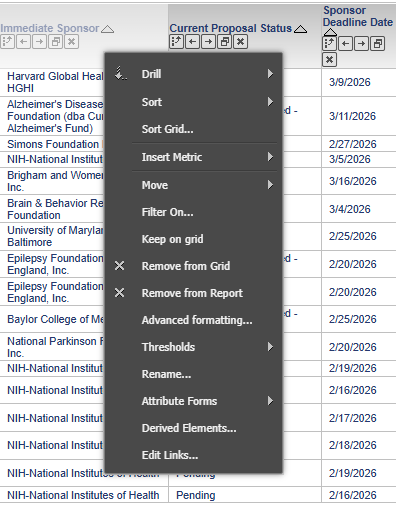
- To remove an object from the Grid, either click-and-drag the object out of the Grid or right-click on the object and select “Remove from Grid.”
- To filter on a specific object, right-click on the object and select “Filter On…”. This will add the data object to the View Filter, where you will need to detail the specifics, you wish to filter on.
Filtering Your Report:
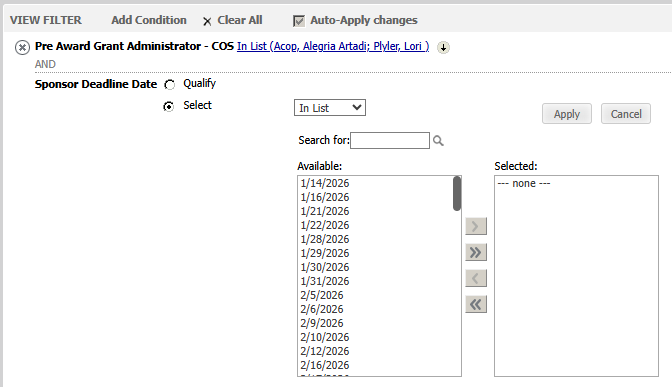
When filtering on a data object, you have two options for defining your filter: Qualify or Select.
In “Select,” you are provided a list of possible results found in the data for you to select from. You also have the option to filter for datapoints “In List” or “Not in List”.
In “Qualify,” you provide the specific detail to filter on rather than selecting from a list. You can prompt Strategy to use a variety of considerations for your data point, such as Less Than, Greater than or Equal to and Is Not Null. “Qualify” works particularly well when filtering for data before/after a specific date or for data that does/doesn’t have a response (Is NULL/Is Not NULL).

To remove a View Filter, click the “X” next to the filter you wish you remove. To edit the filter, click the words in blue font.

Creating a Personal View - Report:
A report allows users to create their own personalized version of the report using above mentioned tools and features. These Personal Views save your prompting and filtering so you can automatically view the data report you are interested in without changing the underlying report structure that other users see. To view the saved personal views, go to home page, click on ‘My Subscriptions’ which displays all the personal view subscriptions.
To create a Personal View:
1. Select the Personal View icon from the toolbar as seen below
2. Name your Personal View and select “OK"
3. Your Personal View is saved and you are returned to the core report. You will see a success message, which you can click to go to your specific Personal View
4. In “My Subscriptions,” you can see your full list of Personal Views. To run your Personal View, click the underlined name of the report.
To delete a personal view, select the corresponding check box under Unsubscribe column and click Unsubscribe header button.
