October 15, 2024
ERISXdl Grafana
Introduction
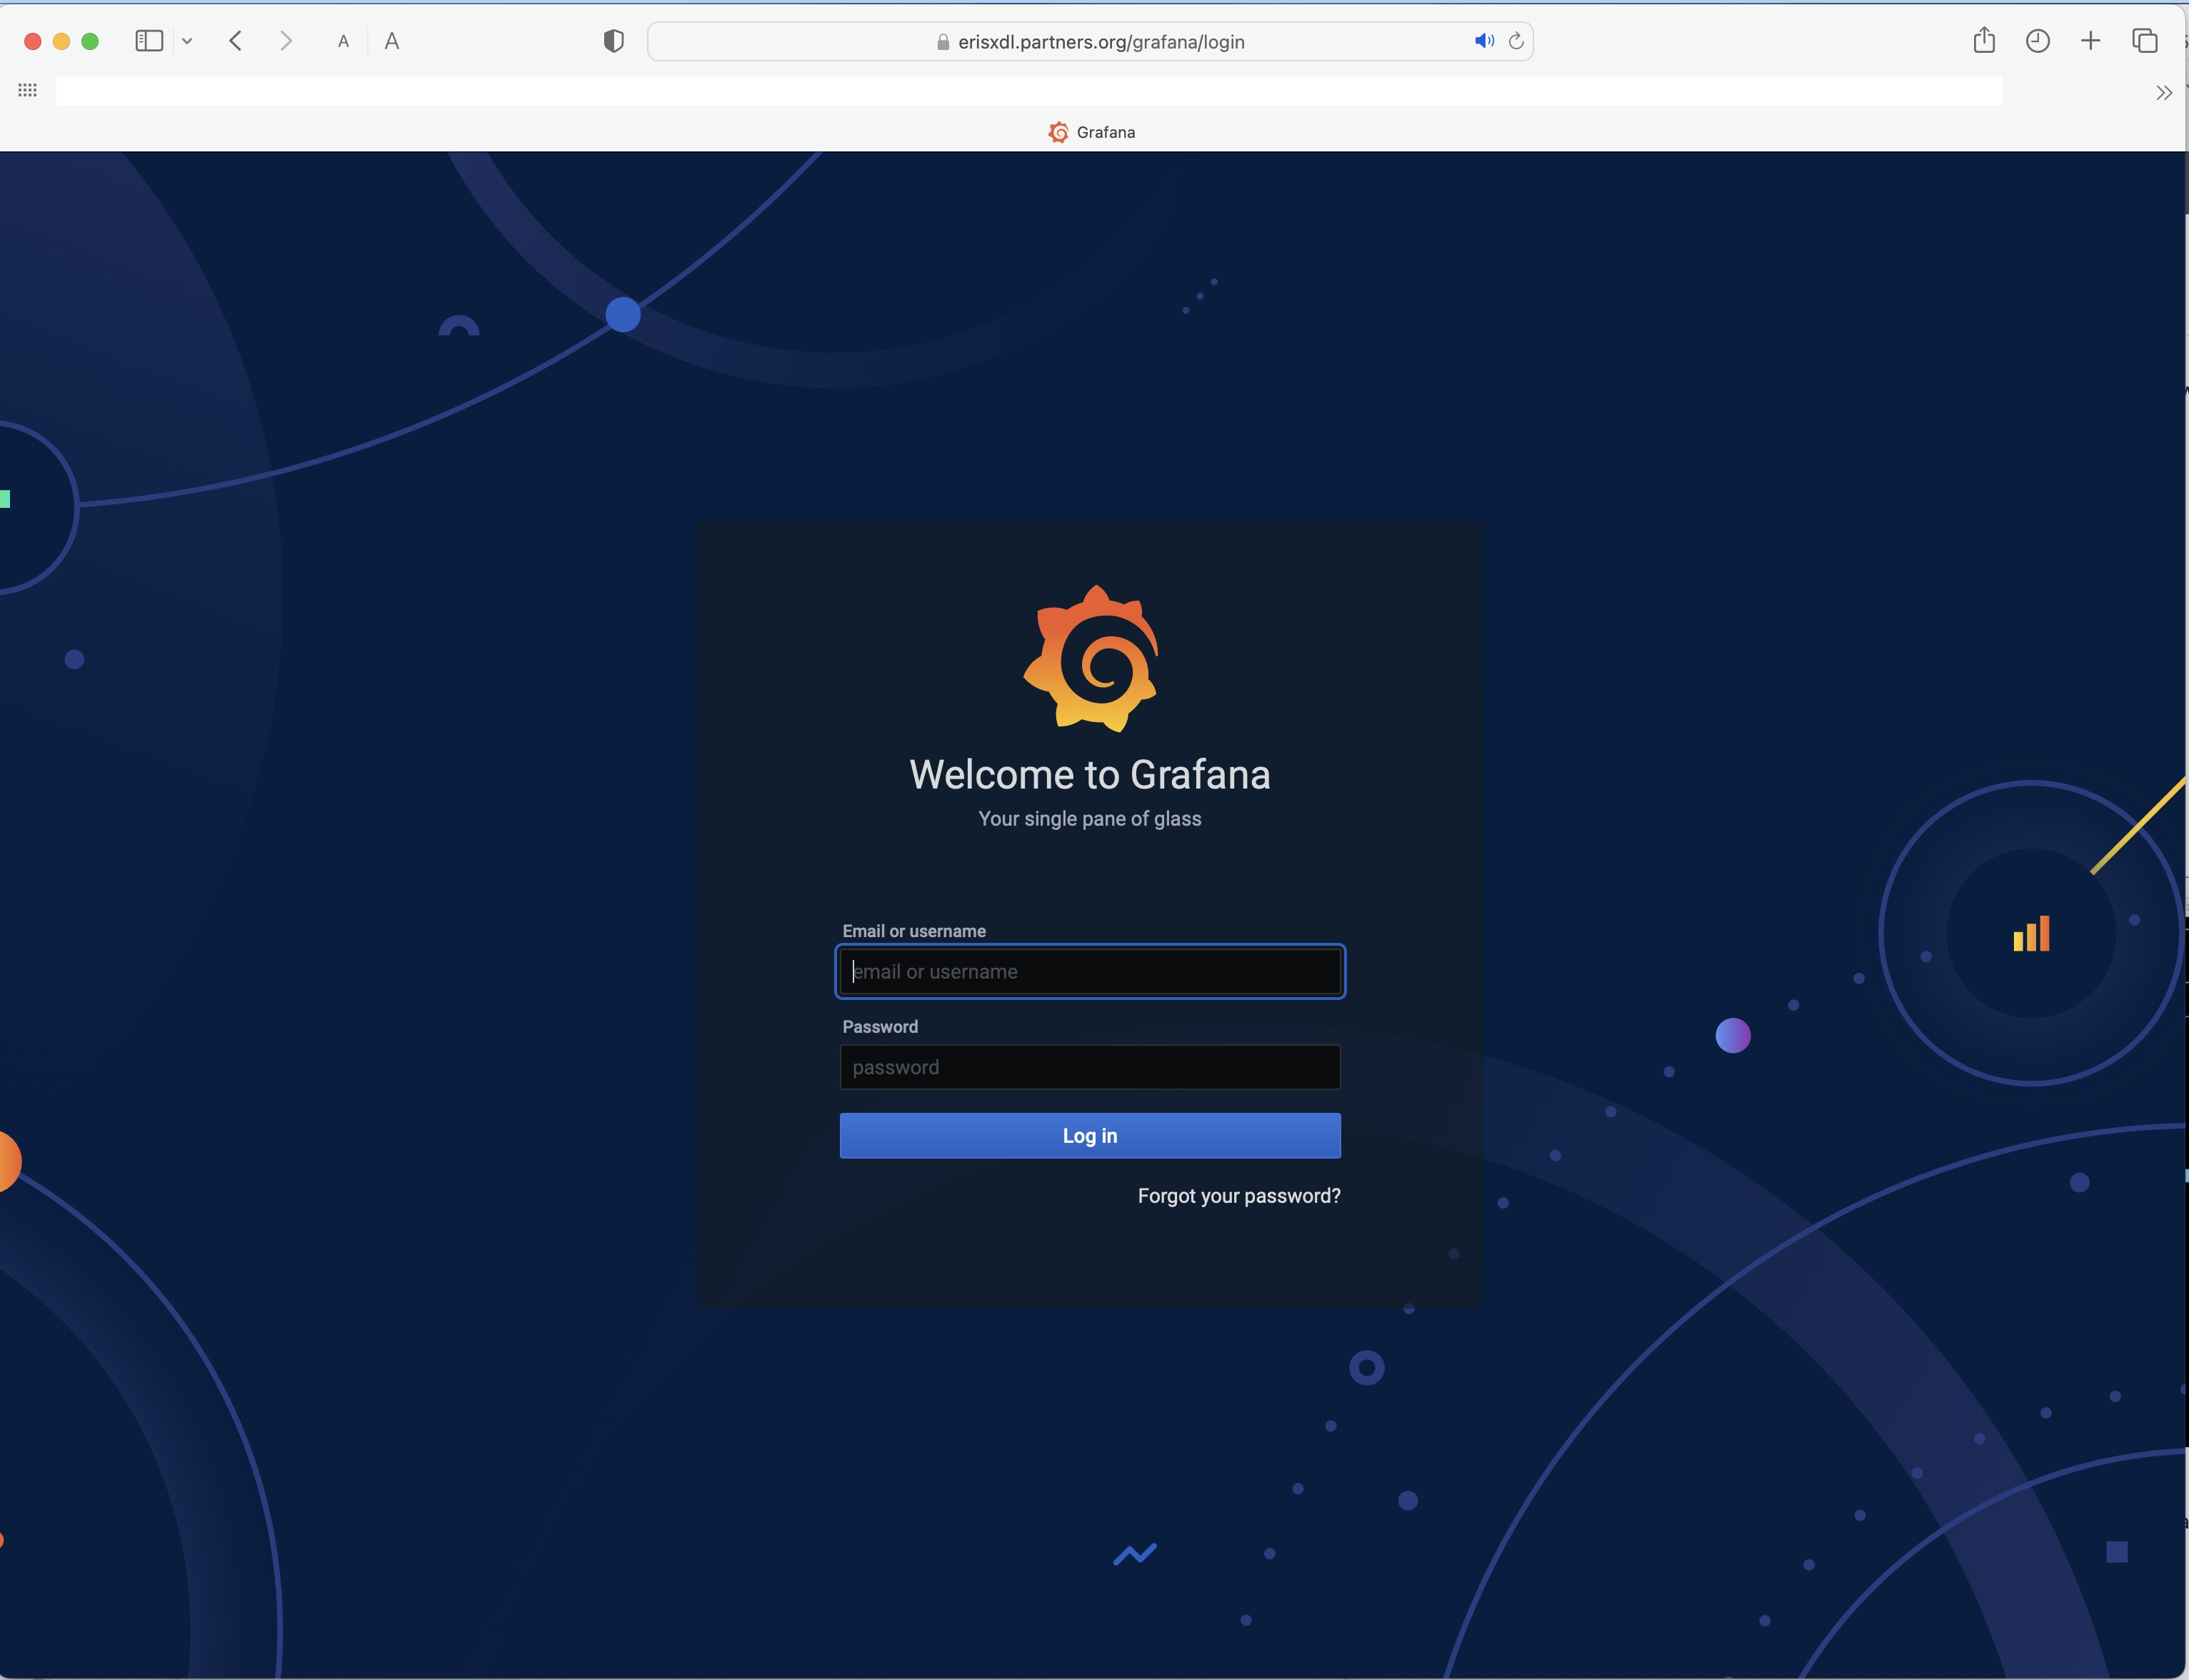
The resources consumed by ERISXdl/Slurm jobs can now be conveniently monitored using Grafana from the following web portal
https://erisxdl.partners.org/grafana/login
whose access details can be found at:
/data/erisxdl/grafanaPublic/README-ACCESS.txt
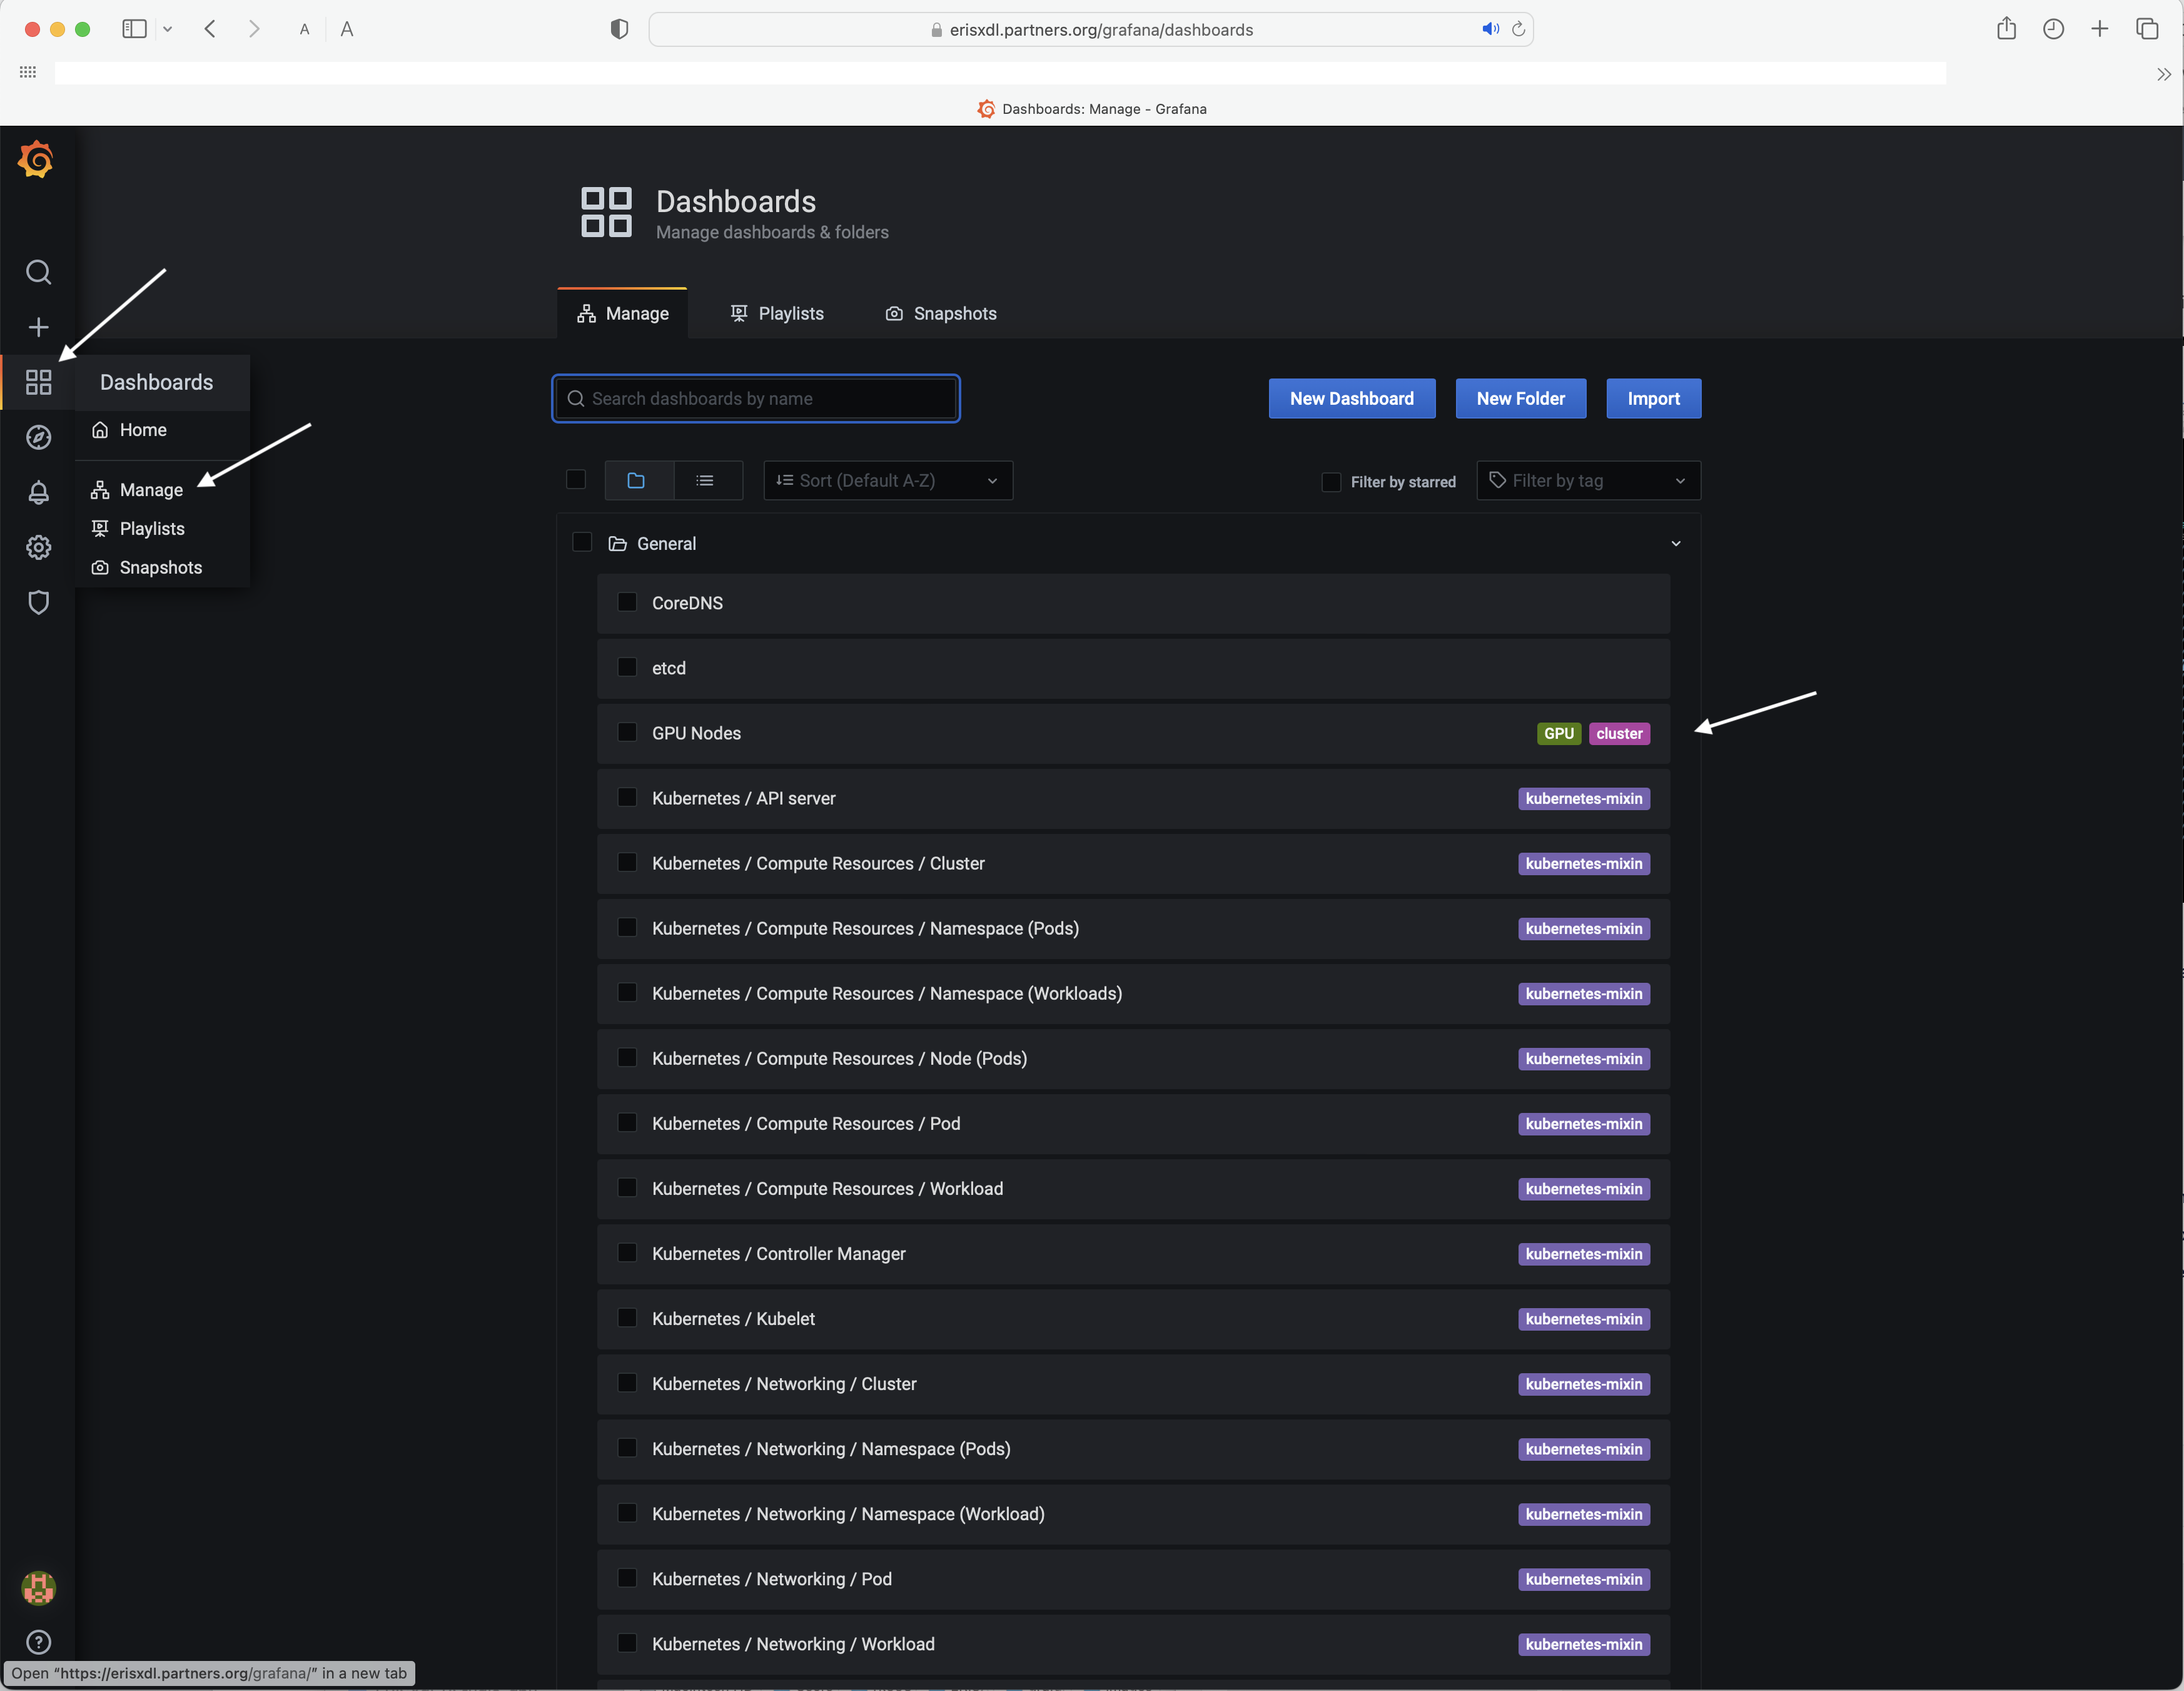
A wide range of default dashboards is available and where the most relevant for monitoring the combination of memory and GPU utilization in a Slurm job can be found under Dashboard/Manage/"GPU Nodes" as is illustrated later.
As shown below, users may wish to generate their own customized dashboards in which case they are strongly urged to save these as .json files to their local PC. These can be subsequently uploaded to the web portal should it be necessary to restart the container running Grafana. When this occurs the original container with the default set of dashboards will presented to the user.
Please note, the container will only support a limited number of concurrent grafana web sessions so, in consideration of others, please remember to log out when a monitoring period has been completed.
Dashboard Customtization
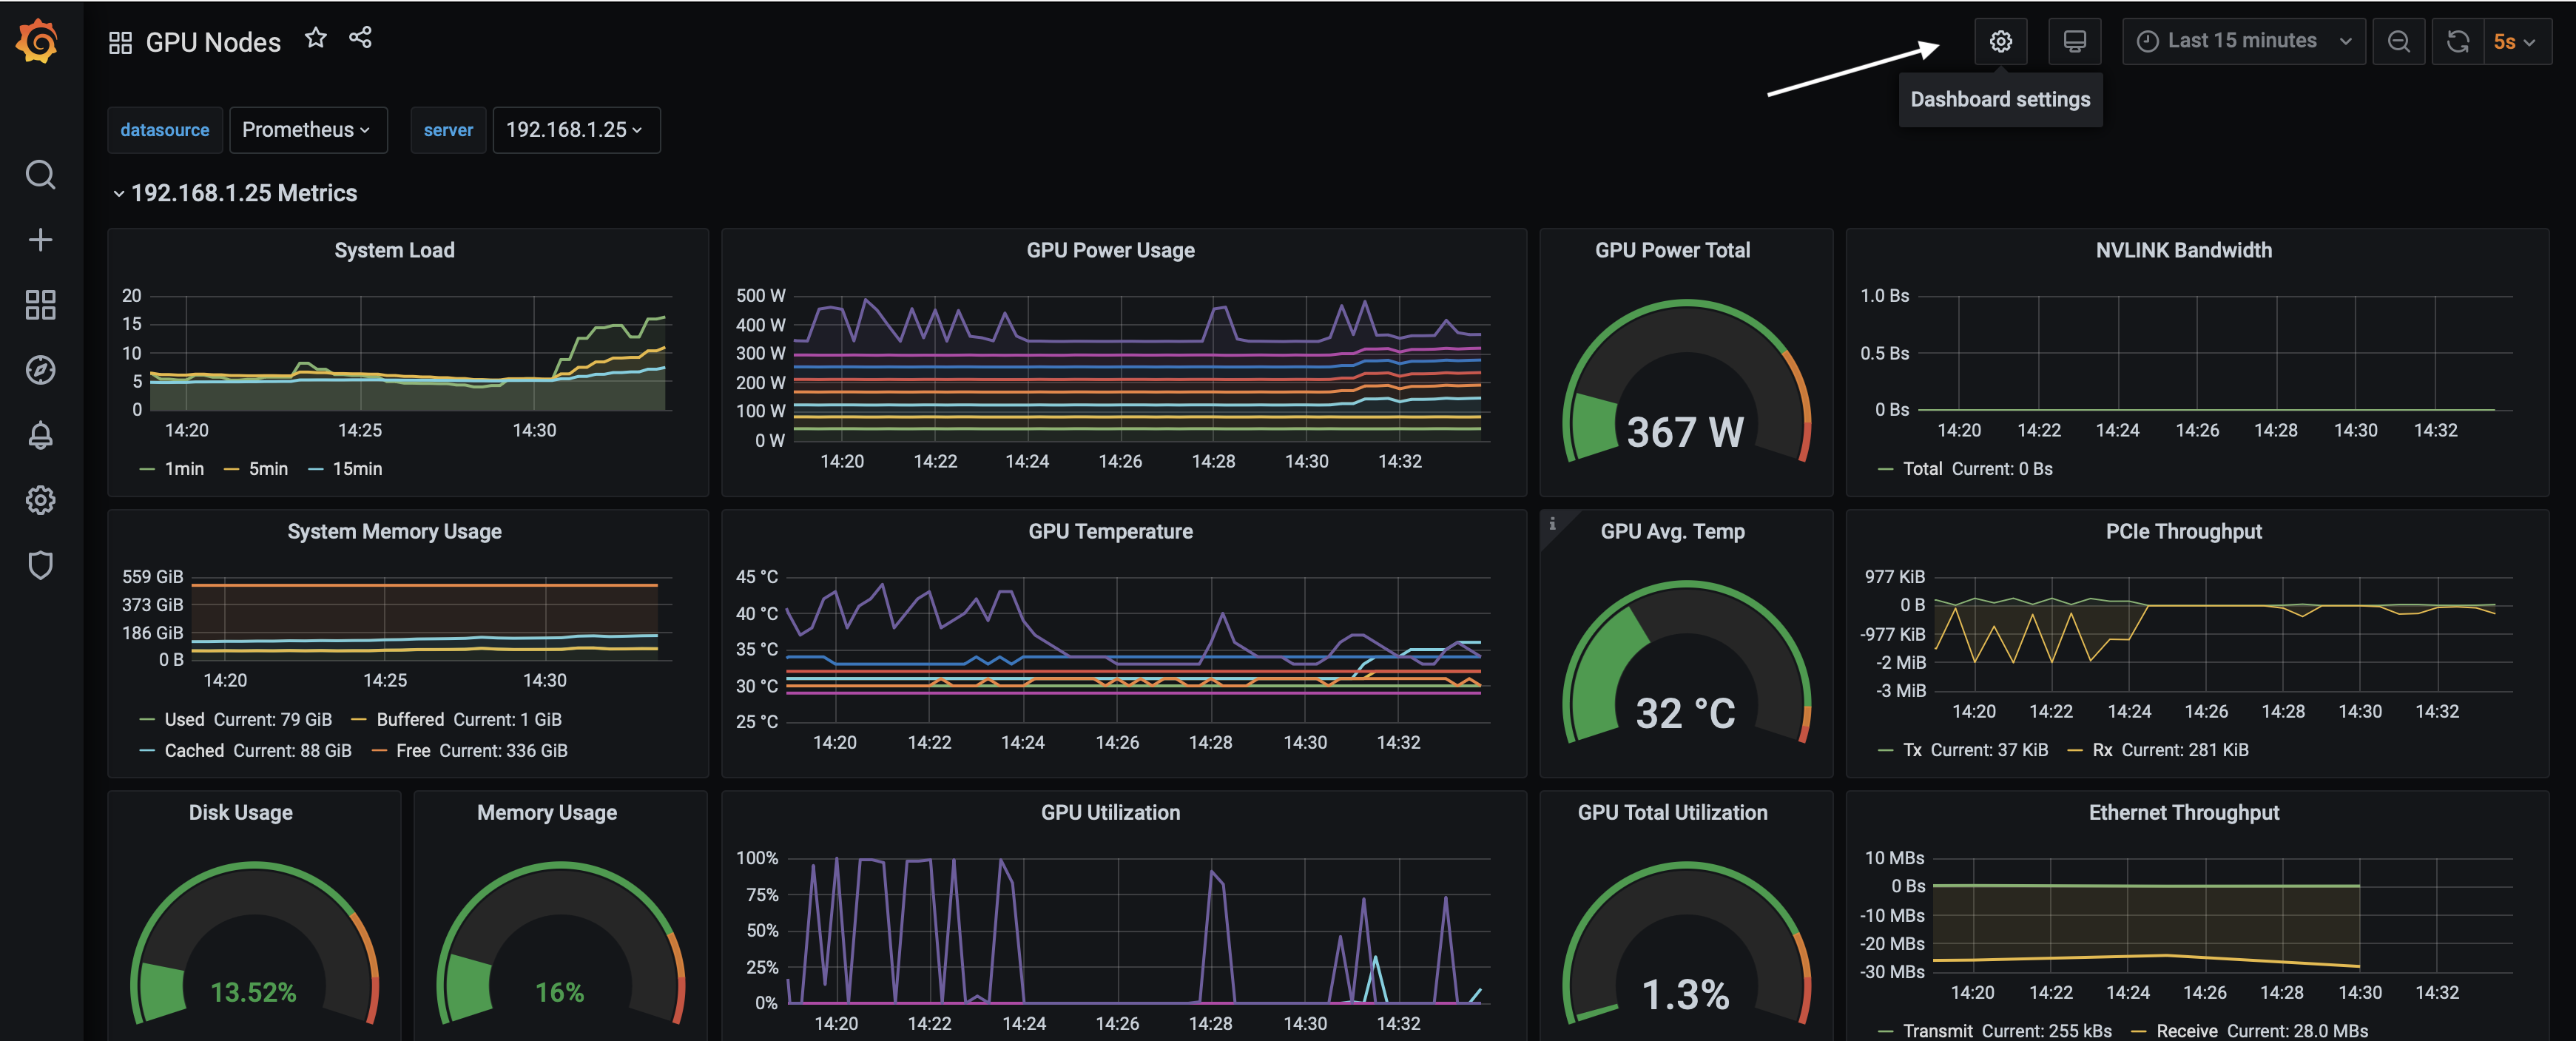
There are many default dashboards with a particularly useful example being "GPU Nodes" (see image) which includes the simultaneous monitoring of both memory and GPU utilization. This is a convenient starting point to illustrate how customization might work.
- Step1: Select the "GPU Nodes" dashboard and then click "Dashboard Settings":
- Step2: Inspect the JSON code.
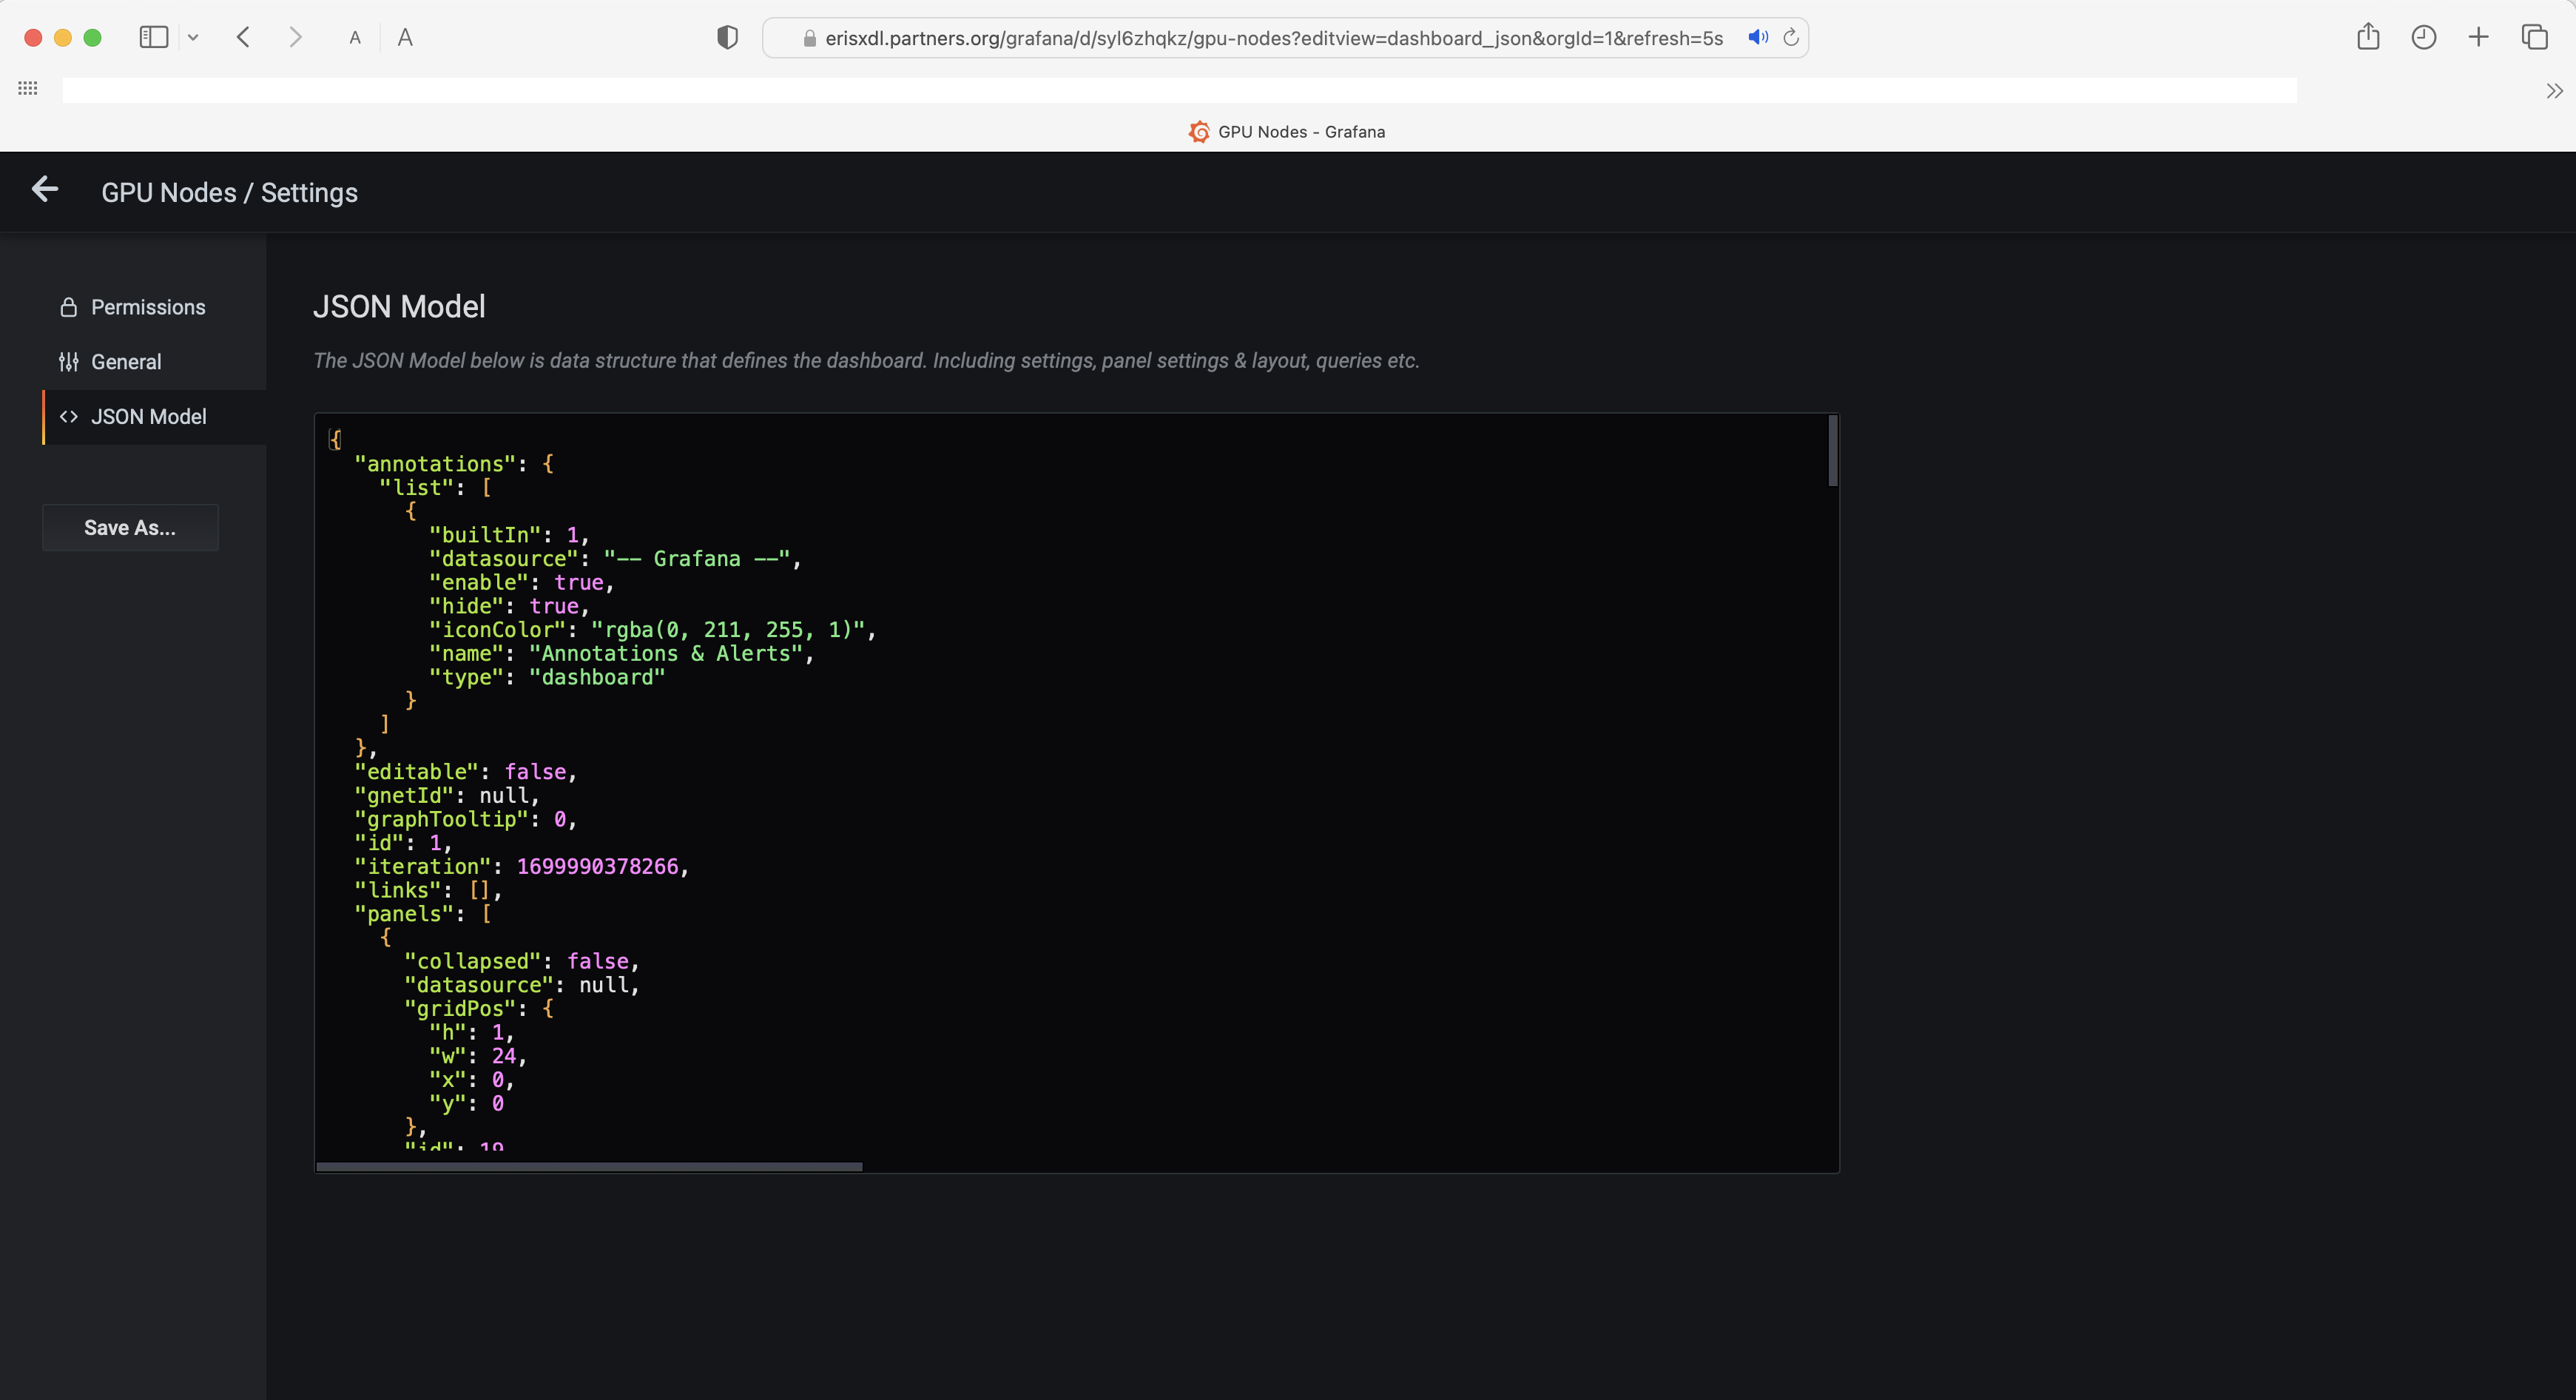
- Step3: Save the JSON code to a new dashboard and subsequently edit the newly-saved dashboard by adding new panels for example.
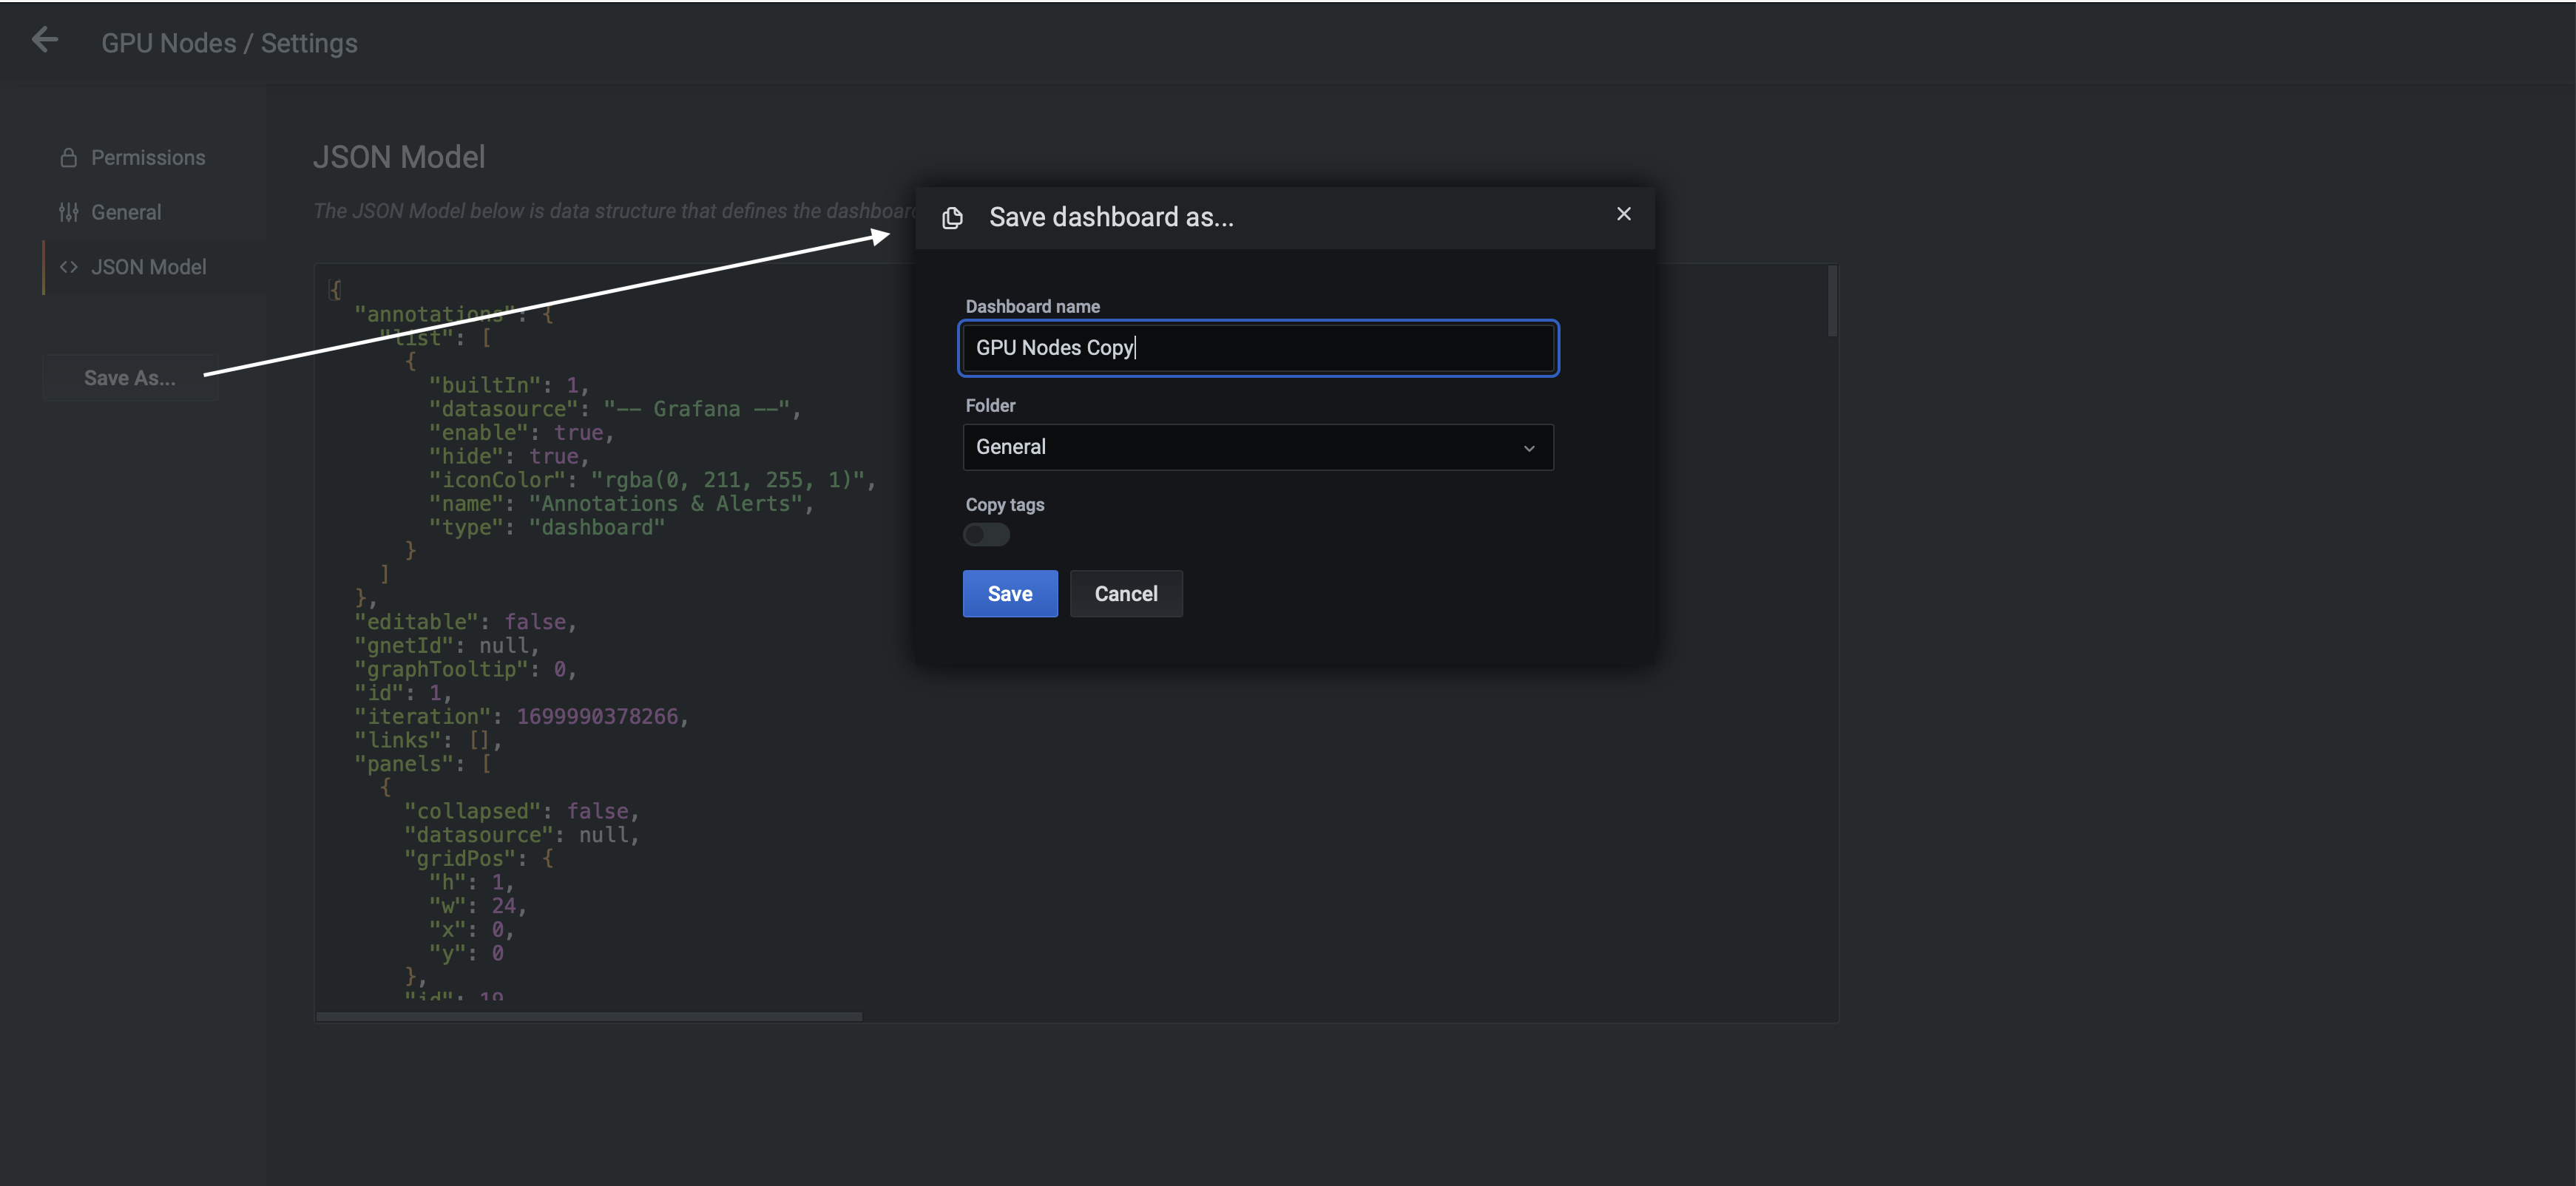
- Step4: Once customization is complete, COPY-PASTE the resulting JSON code into a text file (extension .json) on your local pc.
Importing Customized Dashboards
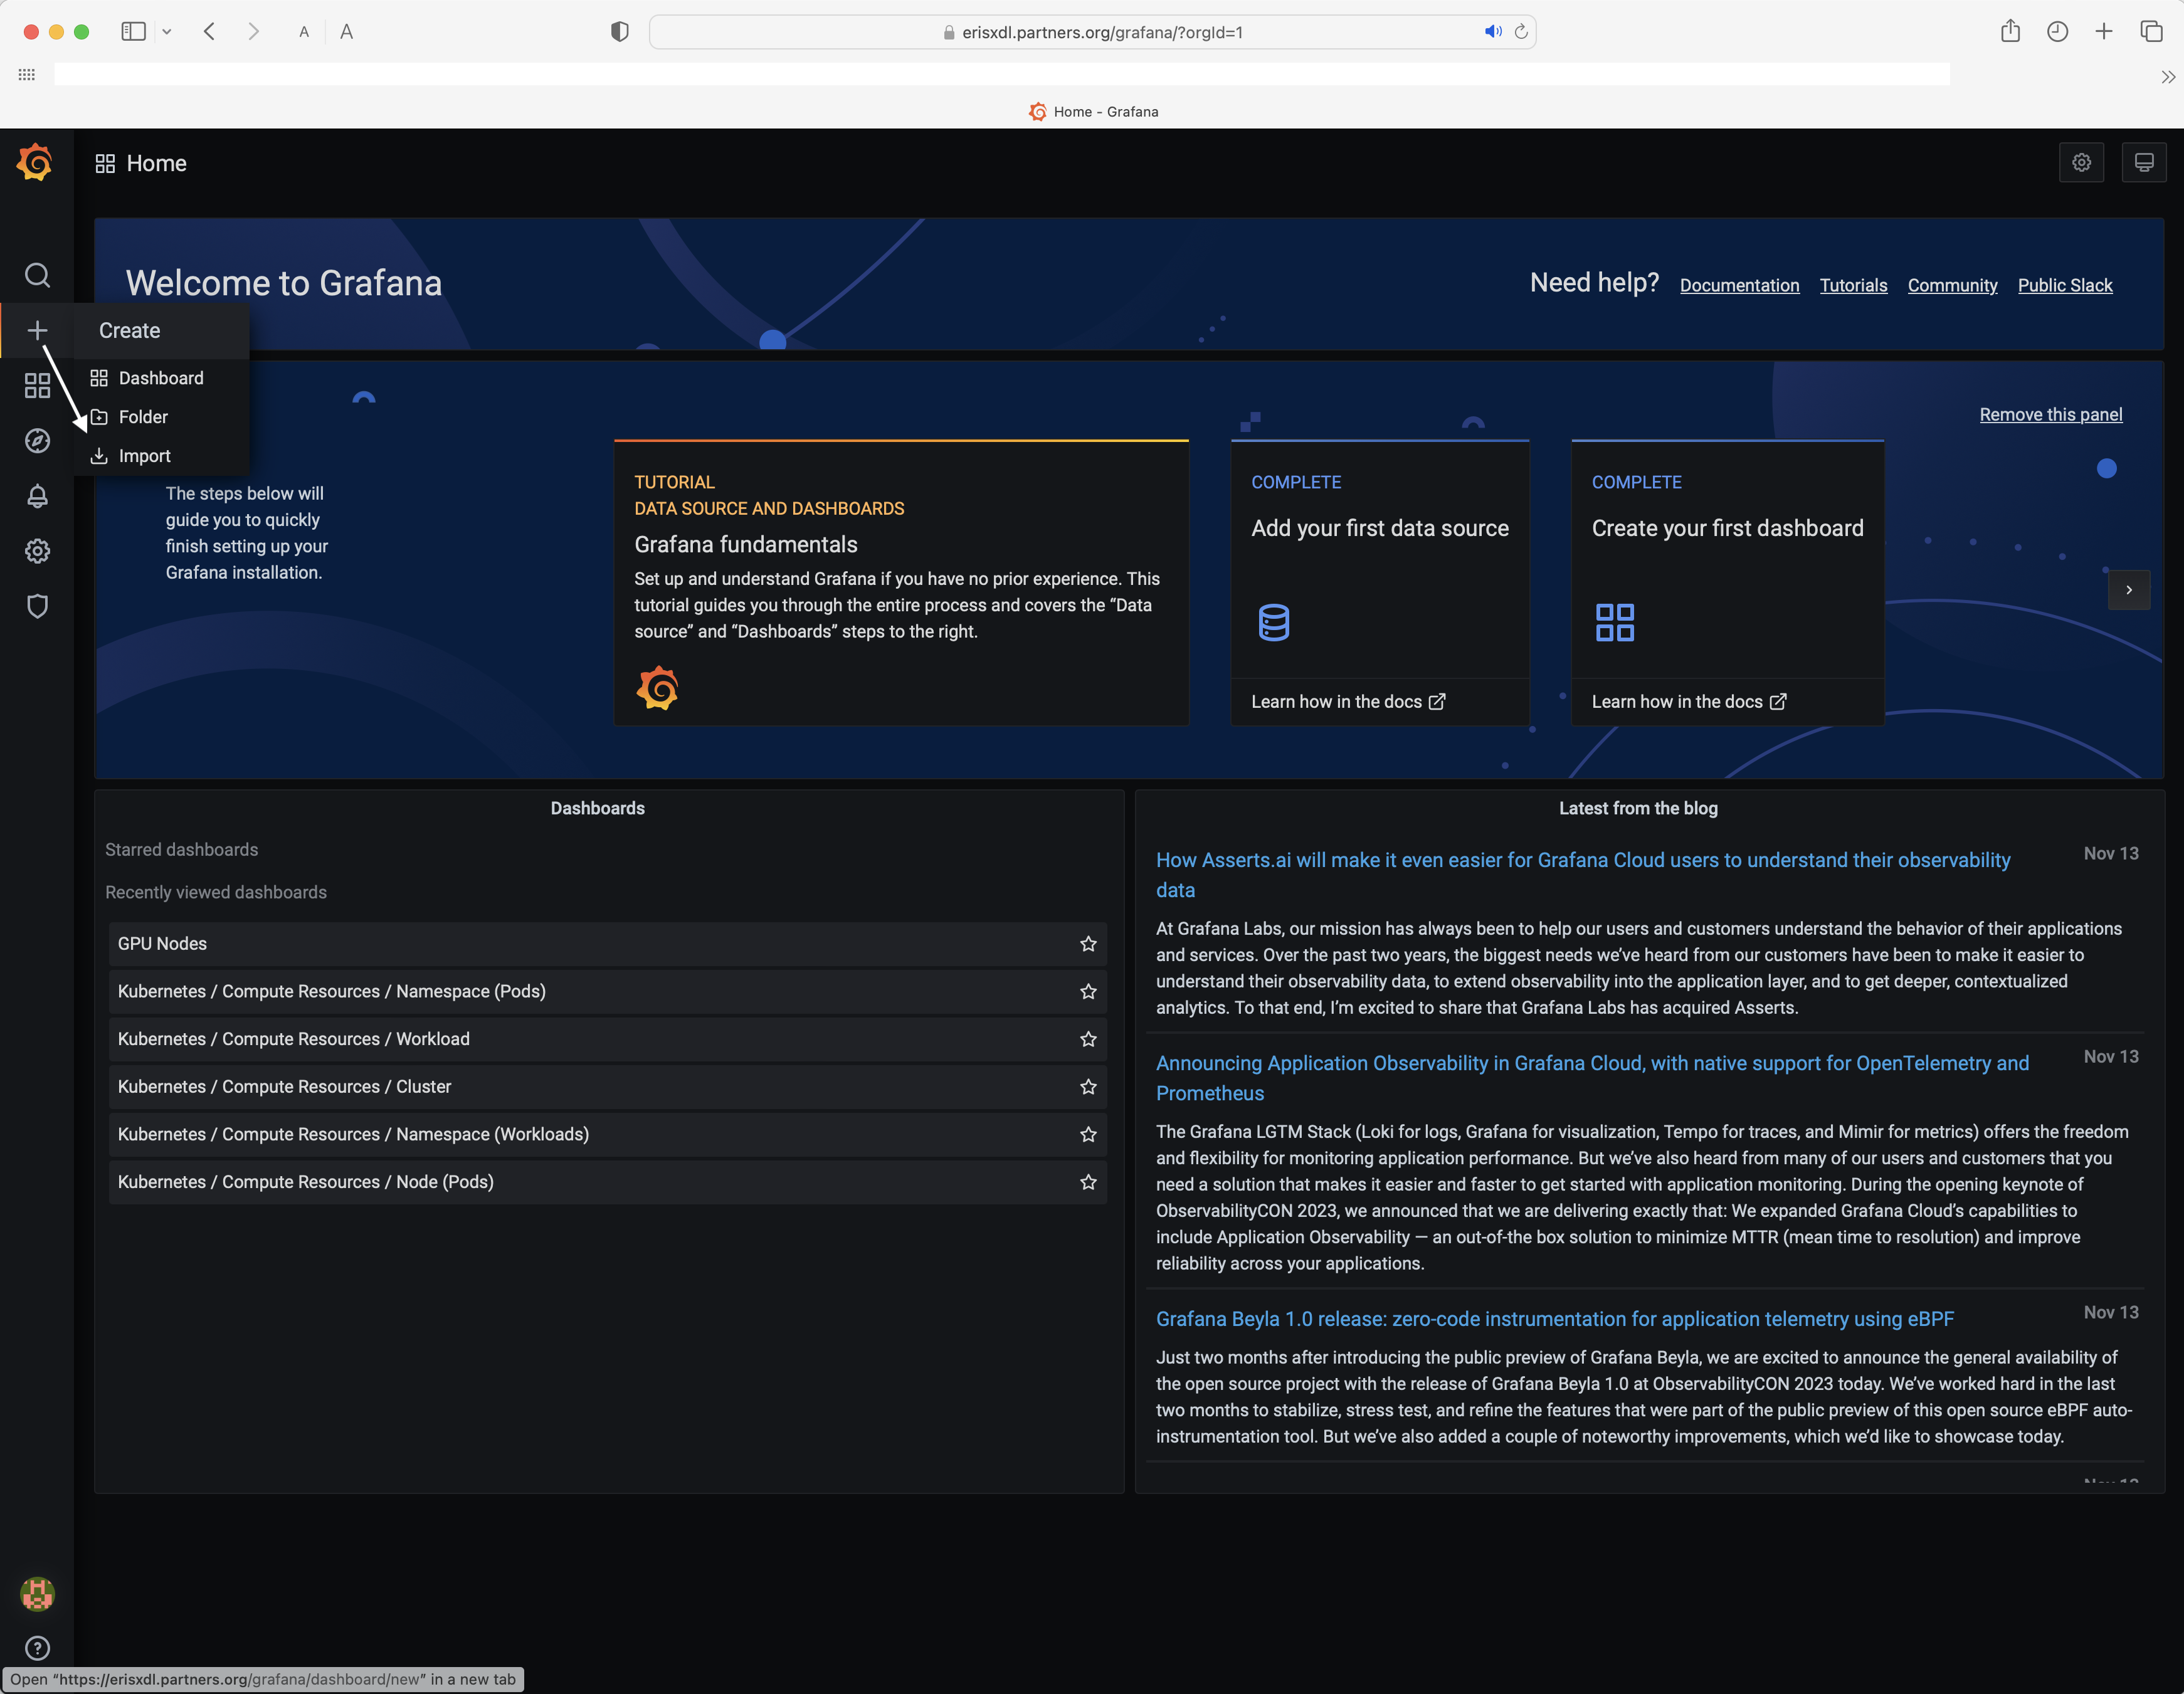
- Step1: Click "+" on the LHS of the Grafana webpage to access the import dialog box.
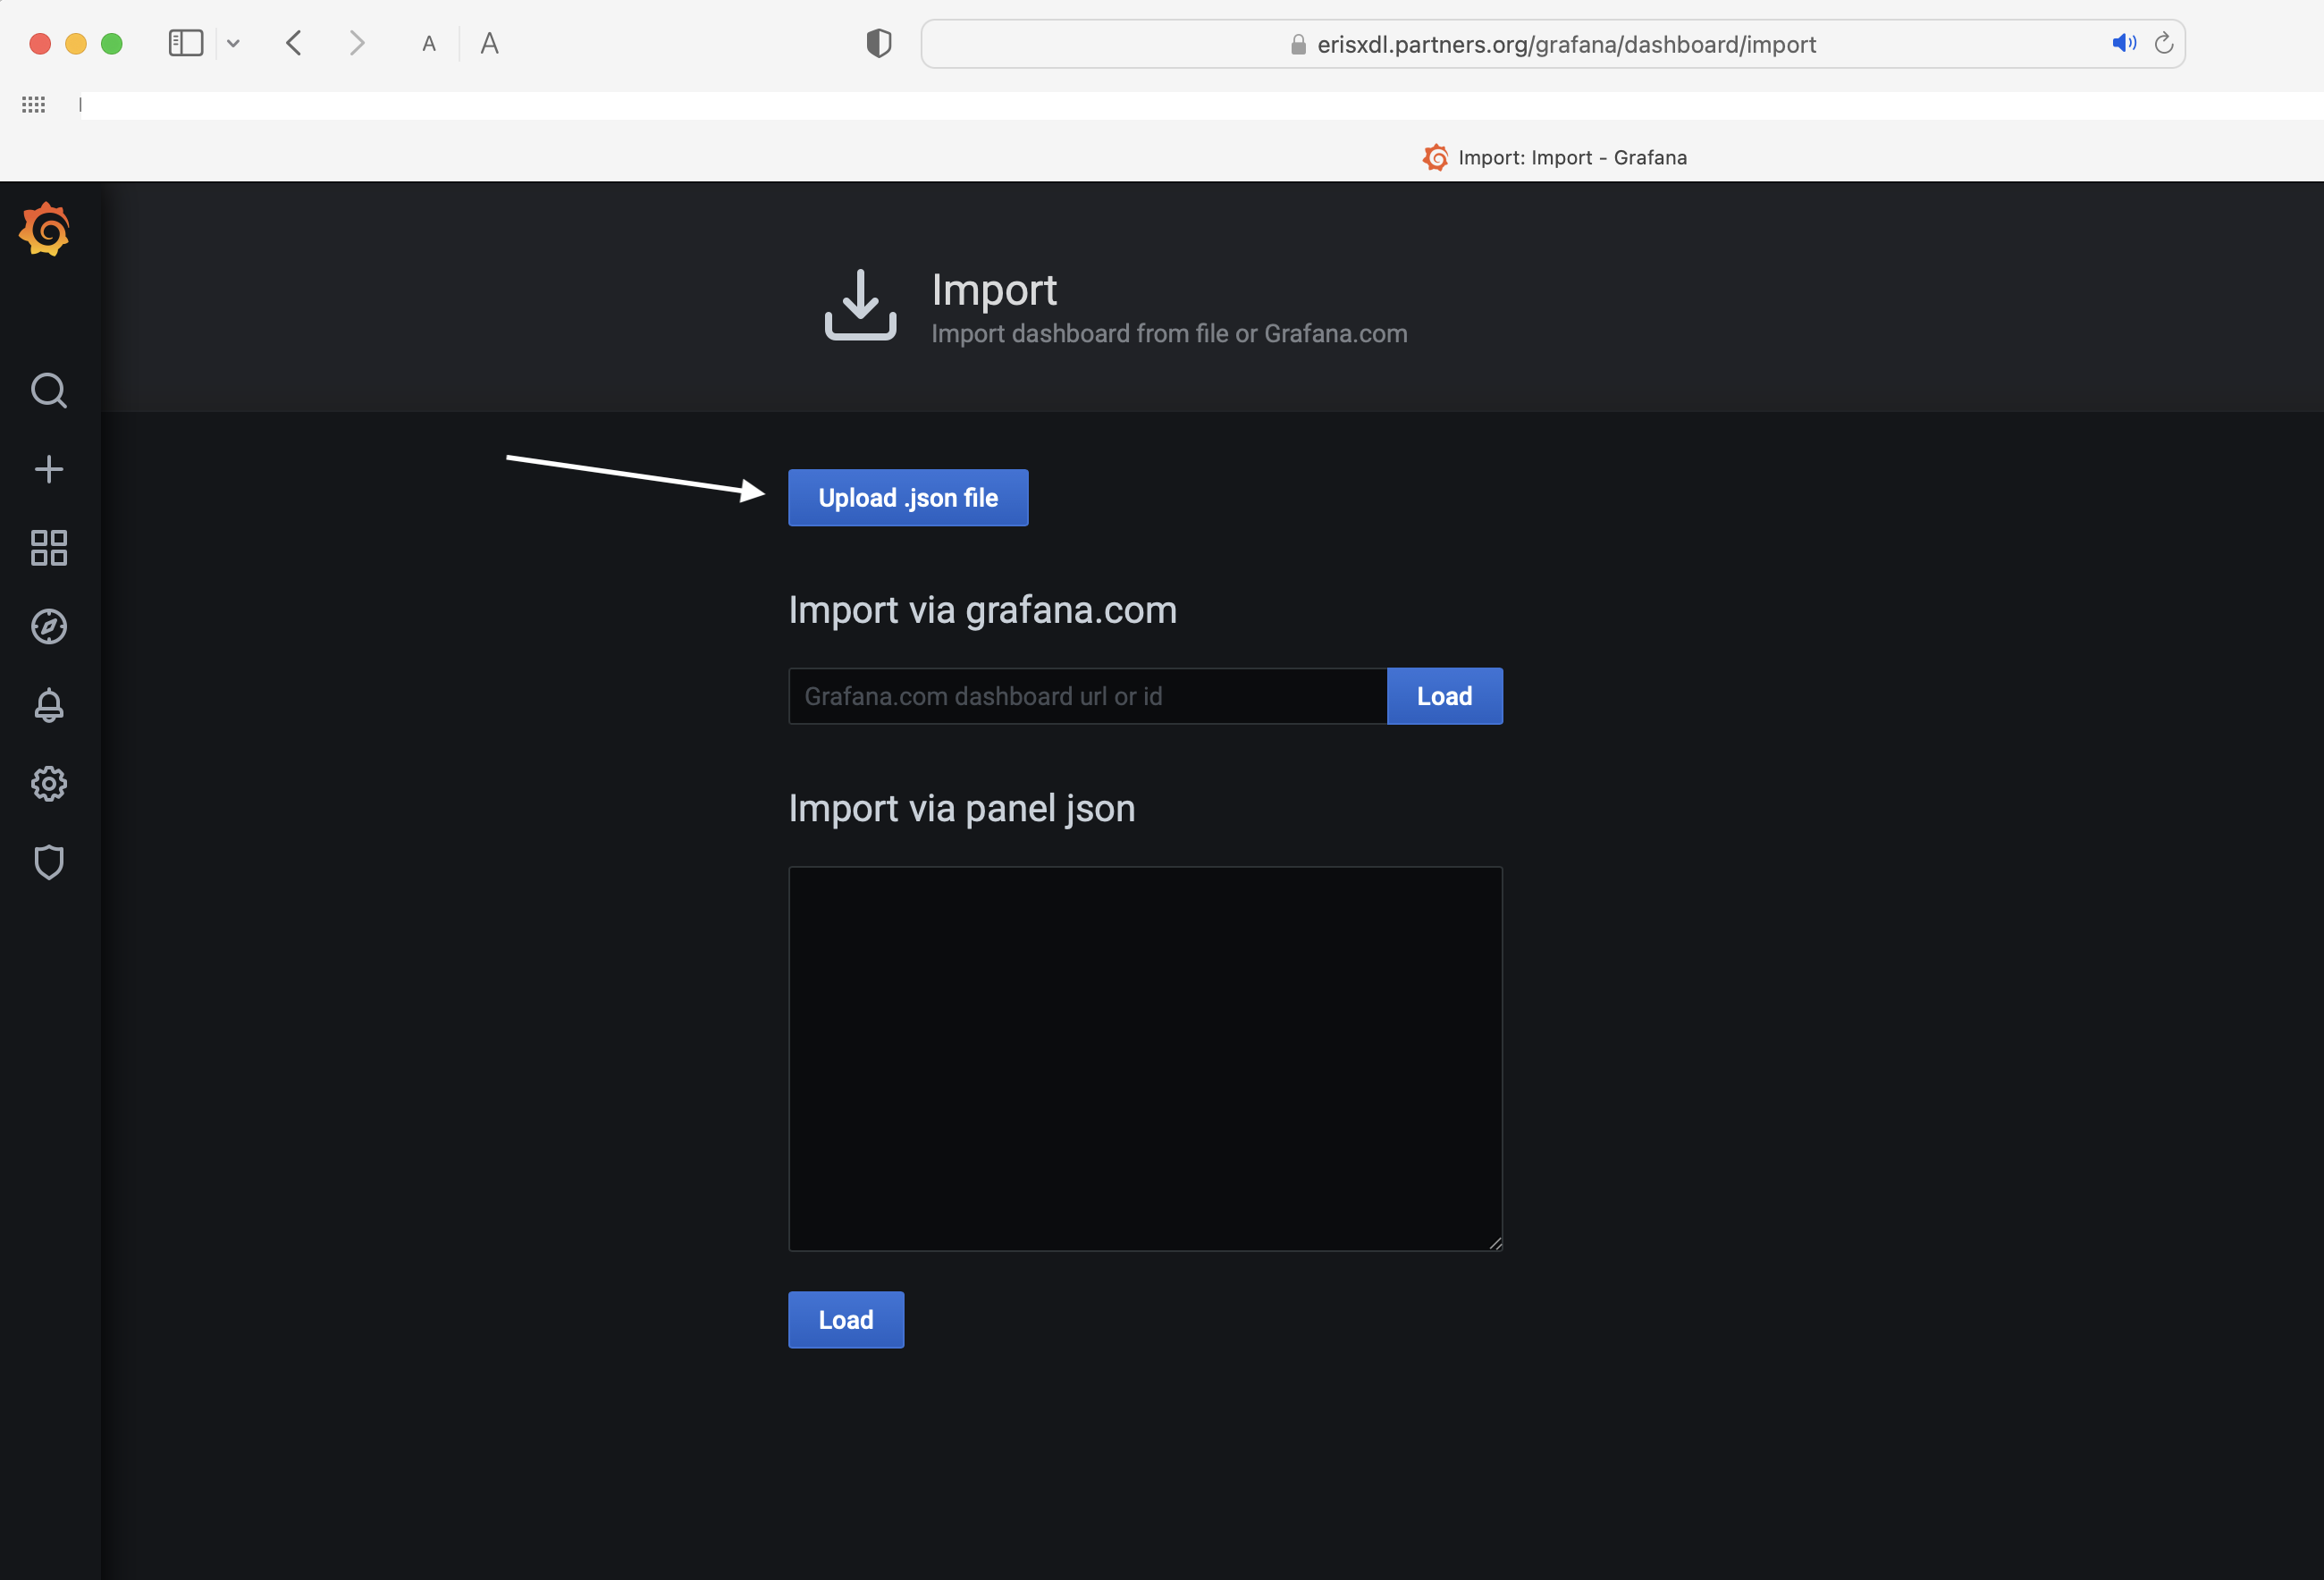
- Step2: navigate to and then upload the local json file
Finally, if you employ dashboards obtained from third party websites, for example, please remember to rename the datasource to prometheus amongst other possible edits.
