REDCap Report FY23
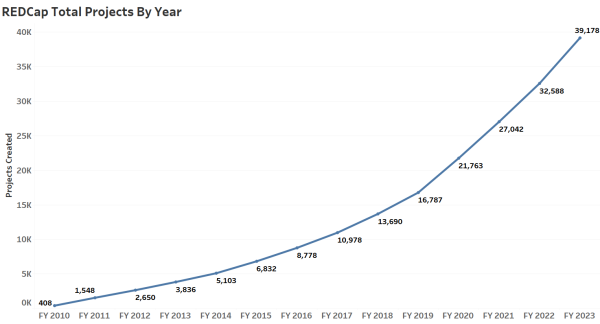
Since REDCap’s first pilot project at Mass General Brigham in 2009, the program has now over 39,000 projects and steadily growing.
Since REDCap’s first pilot project at Mass General Brigham (MGB) in 2009, the program has now over 39,000 projects and steadily growing.
Project Stats
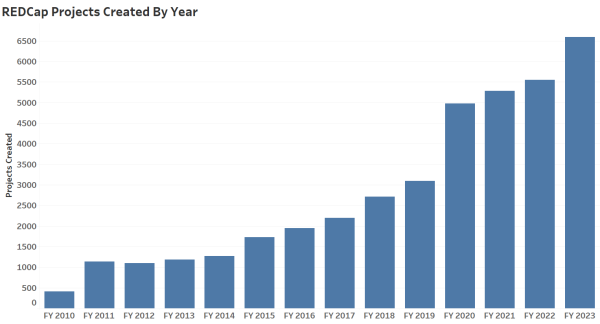
- In the first FY2010 of REDCap support
- 704 new projects created
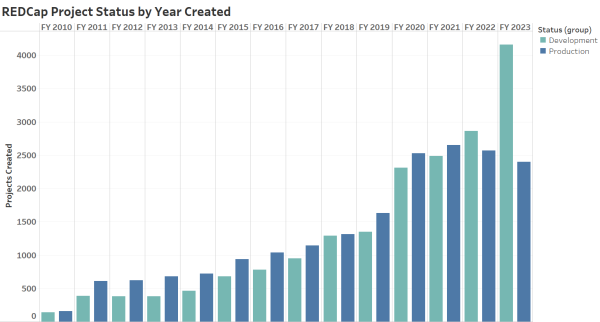
- 219 projects moved to production
- In FY2023
- 6624 new projects created
Of the FY2023 6624 new projects, 2944 projects moved into production mode to actively collect real data.
Projects by Institution
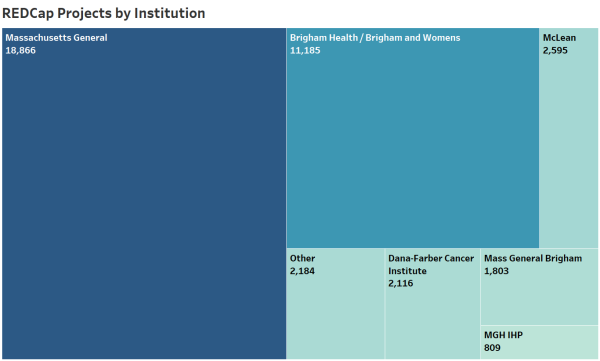
MGH (48%) and BWH (28%) are the biggest consumers of MGB REDCap.
Project Types
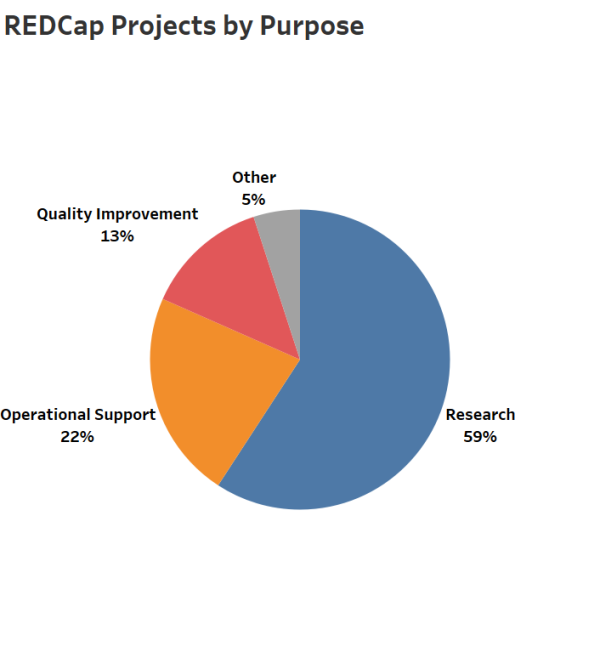
MGB REDCap is not just for Research, although it is the best fit and highest use case at 59%. It can be used for Quality Improvement (13%) projects, Operational Support (23%), and any MGB business or research related need.
Project Type By Institution
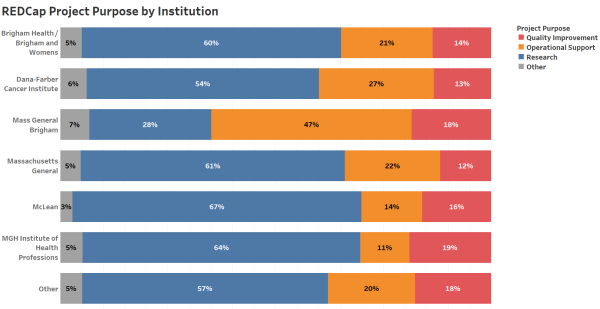
Distribution of REDCap usage per institution with respect to project type. These normalized percentages show the top contributors to research, operational, quality, and other type of REDCap projects.
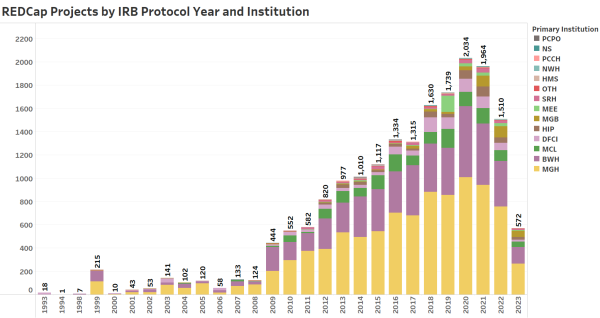
Number of MGB IRB Protocols
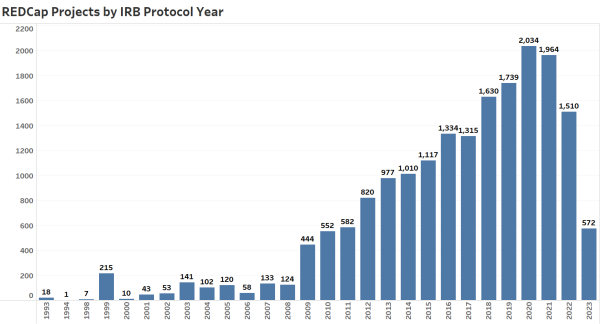
There are a total of 6,191 MGB IRB protocols using MGB REDCap to collect study data. Protocols are listed below and grouped by protocol year. Some protocols require multiple REDCap projects for data collection.
User Stats
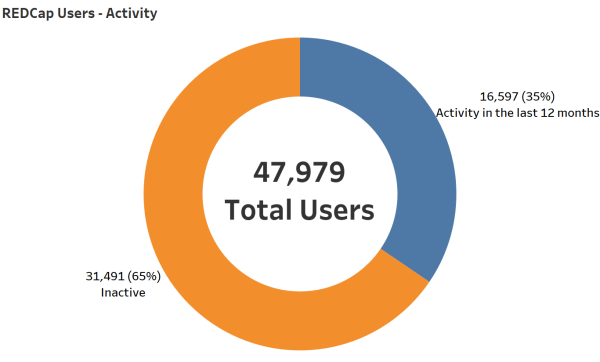
REDCap’s user base is also growing steadily. Total Number of REDCap User Accounts: 47,000+ with 34% Active for FY23. On average, there are 6332 active users per month.
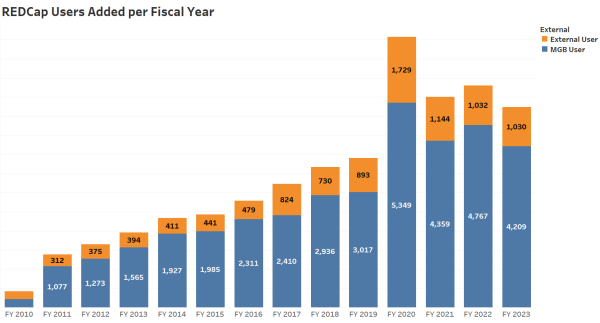
There were a total of 5239 new accounts added in FY23. There is consistent growth over time with a spike in FY2020 due to Covid and social distancing requirements.
Support Stats
MGB REDCap Resource Center is provided to help users learn more about REDCap. When users have questions, support is primarily provided by an email inbox. Many routine tasks that require administrator approval are generated from within REDCap itself to aid in automation. Support tickets are managed via the Jira Support tool.
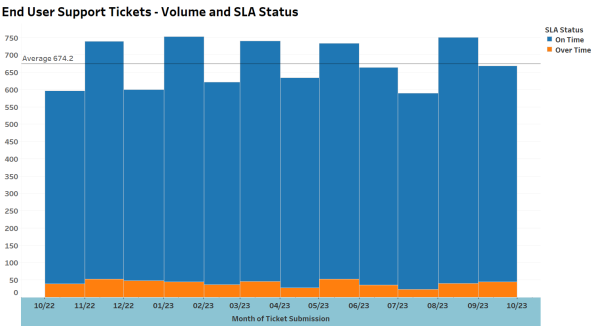
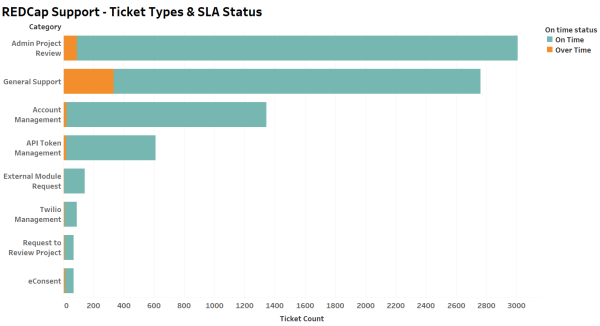
REDCap End User Support consists of 1.75 FTEs funded jointly by the Harvard Catalyst | The Harvard Clinical and Translational Science Center and MGB. Response times on average are under our service level commitment (SLC) of 2 business days.
The MGB REDCap Support team received a total of 8,090 support tickets in FY23 with an average of 674 requests per month. 94% of tickets were closed within the SLC window.
In Person Support Hours
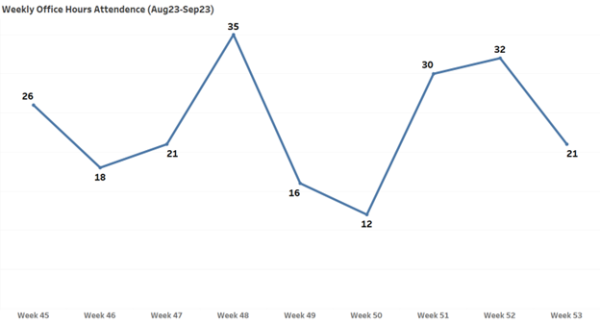
The MGB REDCap support team offers 1:1 in person support office hours 3 days a week. These office hours are heavily attended and in 2023 were expanded to meet growing demand.
-
Over 312 hours of in-person support were offered to end-users.
-
Over 364 unique attendees participated in office hours.
Link to REDCap Support Office Hours Info
Note: Metrics on office hours were not available until August of 2023.
MGB REDCap API Support
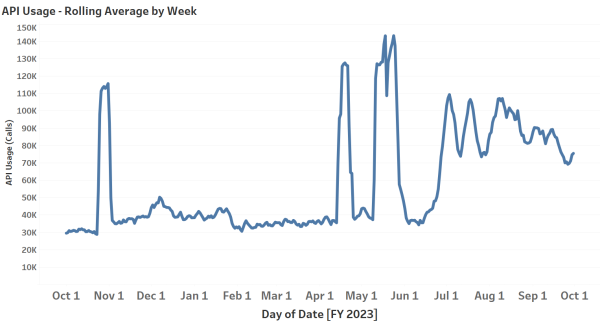
REDCap’s API (Application Programming Interface) functionality is being actively used by end-users and it has recorded large amount of activity. There are 217 active users with API access. There are on average 75,000 API calls per day.
MGB REDCap eConsent Support
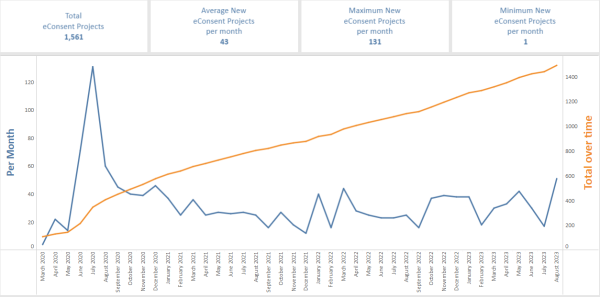
The MGB REDCap eConsent Framework allows researchers to collect Informed Consent documentation electronically. It is also validated for 21 CFR Part 11 compliance. There are 1,561 total eConsent Projects in MGB REDCap.
MGB REDCap and MGB eCare (EPIC)
REDCap’s Clinical Data Pull utilizes standard FHIR web services and MGB FHIR services to import structured data from EPIC into REDCap projects. There are 24 projects actively adjudicating EPIC data into MGB REDCap.
MGB REDCap and MGB Texting Bus
MGB REDCap and MGB Texting Bus Integration went live on September 20, 2023. We now have 10 requests in progress for the integration. The MGB Texting Bus is a tool being offered by MGB Digital to allow you to communicate with your REDCap participants via SMS messaging. This integration will replace the REDCap Twilio Module to allow us to expand on secure SMS messaging options.
Managed Project Support
In addition to standard support, the MGB REDCap team, when available, can provide project development as a fee for service. Support includes programming advanced REDCap functionalities such as customized workflows, advanced calculations, branching logic, External Module configurations and Alerts and Notifications. For FY23, there were 10 new project requests, resulting in 8 accepted and completed projects. The link to request services: redcap.link/fee4service
MGB REDCap Developer Team Support
The MGB REDCap Dev team creates, reviews and deploys External Modules (EM) to multiple REDCap instances at MGB. External Modules provide additional functionality as required per project request. Sharing to the REDCap Repository (Repo) and public MGB REDCap Repo provides additional features to REDCap Community and institutions worldwide. For FY23:
- 64 Total External Modules Deployed and Supported
- 12 New Repo External Modules Reviewed
- 22 MGB External Modules in Active Development (had at least 1 release in FY23)
- 6 New MGB External Modules Created
- 3 MGB Custom EMs Shared to REDCap Repo
HELP US REPORT ACCURATE REDCAP STATS:
Update your REDCap Project’s page


.png)
